MARKET ANALYSIS BY NICK LONEY
A combination of poor quarterly earnings figures and ongoing macroeconomic uncertainty continue to weigh on wind power stocks despite tentative signs of an improvement in orders. All of the listed companies in the sector suffered price declines in the first half of the year - some very painful - apart from China's Goldwind, which continues to buck the overall trend by attracting strong investor interest.
Following a strong first quarter, confidence in equity markets slumped from April onward as the eurozone's less-than-convincing attempts to avoid a Greek tragedy, concerns over a growing Chinese bubble and sluggish growth forecasts for the major developed economies combined to extinguish any lingering new-year optimism. Risk aversion returned, leading to falls among major indices across the world.
Wind power stocks were never likely to perform well in such an environment and their prospects did not improve following the publication of the year's Q1 earnings, which included some wince-inducing figures. Vestas, for example, reported a net loss of EUR82m for the January-to-March period, a massive contrast with EUR56m net profit for the same period last year. The loss came on the back of a 31.6% decline in revenues and a 64% slump in turbine deliveries, contributing to an 8.2% fall in the company's stock price for the year to June 21.
The company blamed its poor performance on a combination of a "considerable" drop in order intake from the autumn of 2008 to the end of 2009 and a more difficult credit market, which prompted it to reduce its 2010 pretax margin forecast from 12% to 10%. However, orders have since picked up: during the first quarter, Vestas received 1.26GW of new orders, followed by a further 2.01GW from March 31 to April 27.
VESTAS
Revenues -31.6%
Ebit -226.3%
Q1 2010 compared to Q1 2009
Stock price -8.2%
Change Jan-Jun 2010
Q1 profit/loss -$99.9m
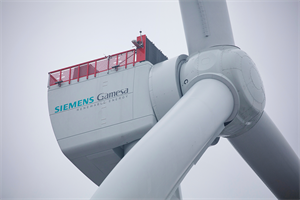
Vestas's pain was shared by Gamesa, which reported a 43% decline in revenues compared to the same period last year despite a 21% order increase over the first quarter. The figures dragged further on the Spanish company's share price, which has fallen 32% so far this year and is currently lower than at any point since listing in 2003. Company CEO Jorge Calvet blamed the poor results on the weak global macroeconomic and financial situation, the effect of which, he claimed, was compounded by sharp seasonal fluctuations and the company's focus on aligning production with customer orders and deliveries. Further problems came in the form of regulatory changes affecting the Spanish wind power industry, which put a six-month break on new orders in 2009 and have, according to Calvet, also dragged on new growth.
GAMESA
Revenues -43%
Ebit -51%
Q1 2010 compared to Q1 2009
Stock price -32%
Change Jan-Jun 2010
Q1 profit/loss +$9.7m
Nordex also cited the difficult order environment in the early part of 2010 as a major cause of its poor Q1 figures, which included a 30.5% decline in revenues and a 9.1% fall in gross profits. However, the company's efforts to reduce its cost of materials and other operating expenses appear to have provided a degree of insulation from the harsh conditions: its gross margin has expanded to 28% and its first-quarter earnings before income tax (Ebit) rose slightly, from EUR0.3 million to EUR0.4 million. Its net profit fell from EUR0.4 million to zero. Nordex's share price has fallen 24% year-to-date, but the company has been boosted by a strong second-quarter surge in demand: in April alone its order intake was 32% higher than that of the whole of Q1. It retains its forecast for single-digit sales growth for the whole of 2010.
NORDEX
Revenues -30.5%
Ebit +33.3%
Q1 2010 compared to Q1 2009
Stock price -24%
Change Jan-Jun 2010
Q1 profit/loss $0
Suzlon chairman Tulsi Tanti toed the industry line in blaming the challenging market conditions for his company's 2009/10 results, which it published in May. The company's consolidated January-to-March figures revealed a 33.3% slump in gross revenues and an overall net loss of INR 1.88 billion ($40.3 million), compared to a net profit of INR 4.1 billion ($88.6 million) over the same period in 2009 - a decline of 146%. The company's share price has fallen 36.3% this year.
SUZLON
Revenues -33.3%
Ebit -36.9%
Q1 2010 compared to Q1 2009
Stock price -36.3%
Change Jan-Jun 2010
Q1 profit/loss -$40.3m
However, Suzlon will have been greatly comforted by the performance of its German offshoot Repower, whose annual 2009/10 report, also published in May, showed that the company had bucked the overall industry trend by achieving an impressive 8.5% gain in revenues and an 11.5% uptake in net profit compared to January to March last year. Repower attributed its strong performance to its bulging order book and healthy balance sheet, the latter of which revealed an equity ratio of 46%, almost no interest-bearing liabilities and a reduction in net working capital from 18.3% to 14.8%. The company's operational cash flow for 2009/10 was also impressive at EUR119.3 million. Significantly, $2.54 billion of Suzlon's $3.9 billion order book - 65.1% - sits with Repower.
REPOWER
Revenues +6.8%
Ebit +8.3%
Q1 2010 compared to Q1 2009
Stock price -5.7%
Change Jan-Jun 2010
Q1 profit/loss +$31.5m
The most impressive performance of the quarter by far, however, came from China's Goldwind, whose Q1 figures revealed a 61.6% growth in revenues and a 26.6% rise in net profits. Goldwind's stock is the only one of the listed wind power companies to have risen this year, climbing 5% for the year to June 21. However, this does not tell the whole story: by late April Goldwind's stock was up 44.7% for the year and it remained up as much as 29.7% by the end of May.
Li Yuan, an analyst of wind power equipment for Guodu Securities, says that although the Chinese wind sector has suffered from a number of problems in recent times, such as surplus production capacity and falling prices, Goldwind's management has taken steps to minimise the impact of the tricky market conditions. Such steps include improving turbine designs and producing components for the units in-house. These moves have helped the firm remain profitable despite intensified competition and the subsequent slump in prices, he says. Li adds that the market's acceptance of the firm's direct-drive turbine technology has helped keep its share price generally buoyant.
But the stock swiftly declined in June, following the company's decision to halt plans to raise $1.2 billion on the Hong Kong stock exchange, owing to a deterioration in market conditions.
GOLDWIND
Revenues +61.6%
Ebit +15.5%
Q1 2010 compared to Q1 2009
Stock price +5.0%
Change Jan-Jun 2010
Q1 profit/loss +$37.9m
Clipper did not publish first-quarter results. Its last available data, published in March, covered the 2009 calendar year and revealed a slight improvement in performance on 2008: revenues rose from $737.3 million to $743.5 million, while the company's net loss for 2009 of $241.4 million was less than its 2008 net loss of $313.3 million. By June 21, Clipper's share price had fallen 61.2% for the year.
CLIPPER
Revenues n/a
Ebit n/a
Q1 2010 compared to Q1 2009
Stock price -61.2%
Change Jan-Jun 2010
Q1 profit/loss n/a
CAPACITY ANALYSIS BY DAVID MILBORROW AND BEN WALKER
Although the amount of additional capacity recorded since the beginning of the year is quite modest - around 3.3GW - the underlying growth trend remains strong. Indeed, the latest estimate of world wind capacity is 26.5% higher than the figure recorded at the same time last year. If that growth rate is maintained, world wind capacity will reach the psychological milestone of 200GW by the end of the year.
The table contains some corrections to the end-of-year figures and these have reduced the estimate of overall extra capacity. There have been downward adjustments to the German and Australian numbers as corrections have been made.
Nevertheless, there does appear to be a significant slowdown in Germany, Spain and the US - although this is partially offset by strong growth in Italy and the UK. A number of large developments in South America are under way and some are starting to appear in the figures.
There is some uncertainty over the capacity in China. Indeed, revelations last month that some 9GW of Chinese capacity remains unconnected to the grid mean that the headline figure for China flatters the Far East superpower. For now, the figure stands on the assumption that China will link up its marooned units in due course. If more evidence emerges that some or all of the rogue 9GW are likely to remain unconnected for the foreseeable future, China's figure may be adjusted downwards in subsequent reports.
Although the major developers and manufacturers continue to report large orders, the world recession has led to slower growth. By the turn of the year, oil and gas prices were starting to move upwards from the low levels reached at the nadir of the recession, but that trend has now reversed. This makes wind less competitive compared with the conventional sources of electricity generation. Although lower commodity prices and reduced demand had contributed to an easing of wind turbine prices, the effect is modest.
Confidence in the long-term prospects in the market is reflected by the fact that the major manufacturers are continuing to plan new manufacturing facilities to service foreign markets. The UK's plans for offshore wind, for example, have attracted considerable interest. The manufacturers are also continuing to develop larger machines, many of which include technological developments, such as direct drive, that aim to reduce weight and cost. Offshore wind is now taking off, with projects completed or started in Germany and the UK.
Although wind may now be less competitive compared with the conventional sources of electricity generation, it still has no serious competitor that is carbon-free. It is difficult to see how nuclear can compete without subsidy. Meanwhile, other potentially promising renewable sources, such as wind and tidal, are at an early stage of development, while established players such as solar photovoltaics remain significantly more expensive.
Wind's pre-eminence over other renewables is recognised by the major players, who continue to add capacity despite wind's recent fall in competitiveness with conventional power. Ireland has squeezed into the top three nations in terms of watts per person by adding 111MW in “uåX˜äŠÊ˜·³Ç's latest quarterly assessment (see tables, below and overleaf). It replaces Portugal, which failed to add enough capacity to protect its position. The US continues to do well, adding more than 1GW in this assessment. It is now the eighth-biggest player in terms of watts per person and remains the biggest host of wind power in absolute terms by a huge margin. Indeed, its recent additions mean that it now has built up a daunting 10GW buffer on China and Germany, its nearest rivals.
Meanwhile, the UK and Turkey have made good progress. The two countries have made major additions, both in terms of absolute megawattage and capacity growth as a proportion of their existing fleets.
- The quarterly Windicator is an indicator of the state of play. Changes in the table can be corrections received rather than additions or subtractions. We welcome corrections. The US total is based on AWEA data and the German total based on Betreiber-Datenbasis data.
IRELAND ENTERS TOP THREE - WIND POWER CAPACITY PER PERSON
Rank Country Watts/ Last last
person quarter rank
1 Denmark 659.4 656.6 1
2 Spain 493.7 486.0 2
3 Ireland 373.2 343.2 4
4 Portugal 372.5 353.5 3
5 Germany 313.5 314.4 5
6 Sweden 175.3 175.3 6
7 Netherlands 140.9 140.6 7
8 United States 126.7 123.0 10
9 Austria 124.4 124.4 8
10 New Zealand 124.3 124.3 9
11 Greece 112.9 103.5 12
12 Canada 110.7 107.1 11
13 Estonia 101.4 101.4 13
14 Norway 96.9 96.9 15
15 Luxembourg 87.5 87.5 16
16 Italy 84.4 84.2 17
17 France 81.4 74.6 18
18 Australia 80.4 97.3 14
19 United Kingdom 76.7 68.7 19
20 Falkland Islands 66.7 33.3 21
21 Belgium 55.2 55.2 20
22 Costa Rica 31.3 31.3 22
23 Cape Verde 30.0 30.0 23
24 Finland 28.3 28.1 24
25 Lithuania 25.6 25.6 25
26 Bulgaria 23.6 23.6 26
27 Poland 20.5 22.4 27
28 China 20.1 20.1 28
29 Hungary 19.9 19.9 29
30 Taiwan 19.6 19.6 30
31 Czech Republic 18.8 18.8 31
32 Japan 16.6 16.2 32
33 Turkey 16.0 12.6 33
34 Latvia 12.1 12.1 34
35 India 11.2 10.7 35
36 Chile 10.6 10.7 36
37 Morocco 8.3 8.3 37
38 South Korea 7.7 7.7 38
39 Nicaragua 7.0 7.0 39
40 Egypt 6.2 6.2 40
41 Croatia 6.0 6.0 41
42 Tunisia 5.2 5.4 42
43 Uruguay 5.1 4.2 43
44 Brazil 4.3 3.7 45
45 Mexico 3.9 3.9 44
46 Switzerland 2.5 2.5 46
47 Ukraine 1.9 1.9 47
48 Cuba 1.1 0.6 52
49 Romania 1.0 0.6 51
50 Israel 1.0 1.0 48
51 Iran 0.9 0.9 49
52 Argentina 0.8 0.8 50
53 Slovakia 0.6 0.6 53
54 Colombia 0.5 0.5 54
55 Philippines 0.4 0.4 55
56 Jordan 0.4 0.4 56
57 South Africa 0.2 0.2 57
58 Sri Lanka 0.2 0.2 58
59 Peru 0.1 0.1 59
60 Russia 0.1 0.1 60
61 Ecuador 0.1 0.1 61
62 Bangladesh 0.0 0.01 62

.png)

.png)
