Among a weak environment for equities generally, investors seem unlikely to flock back to the wind power sector until the outlook for orders improves. Throughout 2009 it was widely predicted that demand, particularly in the US, would pick up late in the year. But fourth-quarter results were mediocre and guidance for 2010 has come riddled with caveats.
Vestas, despite reporting record sales and profits on February 10, has seen its share price decline by 12% since the start of the year. The company cuts its guidance for 2010 revenues to EUR7 billion, down from previous guidance of EUR7-8 billion, and reduced their targeted margin range to 10-11%, compared with their earlier guidance for margins of 11-12%. The state of the company's order book appears to be the main focus of attention. The company's EUR2.2 billion backlog of orders represents just 31% of 2010 sales guidance, compared with more than 70% in normal year. And although the company says it expects to receive 8-9GW of orders in 2010 - compared to 2009 orders of just 3GW - as one analyst comments, belief in such a major recovery in orders requires a leap of faith.
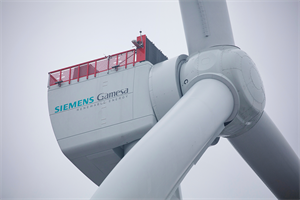
The slide in the price of Gamesa's shares, which began in September, has continued into 2010. On February 25, the company announced a plan to restructure its Spanish operations, but this did little to halt the downward trend and the stock had, by March 10, declined by 18% since January 1, 2010. The company has issued a downbeat assessment of its prospects in 2010, making particular reference to regulatory uncertainty in Spain and difficulties in raising project finance in the wake of the financial crisis.
Shares in Nordex have also performed poorly this year, declining 13% by the middle of March. The company announced fourth-quarter results on March 5, including an expected decline in operating profits to EUR40 million, compared to EUR63 million the year before. The company is scheduled to give detailed guidance for 2010 on April 19.
Repower, as the only European wind power company whose stock reached the middle of March in positive territory for the year - it rose 3% since December - has been a relatively good performer. But the company's relatively solid performance is probably less influenced by fundamentals than by expectations that Suzlon, which owns more than 90% of the firm's stock, will at some point make an offer to buy out the remaining minority shareholders.
Clipper, which performed well into the end of the year on an equity injection from United Technologies announced in December, has performed poorly during the year to date, declining 31.5% by the middle of March.
Suzlon announced third-quarter results on January 30
Like other companies in the sector, Suzlon says it expects orders to pick up in the second half. The company's chief operating officer, Sumant Sinha commented that "our order book is quite decent", adding: "The future is bright for us." But the stock market's reaction to the firm's results indicates a degree of scepticism in the market.
Goldwind, of China, has been the sector's star performer this year to date. On January 26, the firm raised its guidance and, on March 3, announced net profits in 2009 had risen 90% to CNY 1.75 billion on a 66% increase in sales to CNY 10.7 billion. The stock has since weakened amid concerns that turbine prices in China may have dropped as much as 30% and that 40% of China's wind turbine production capacity was sitting idle as demand has failed to keep pace with the huge increases in manufacturing capacity.
SECTOR DEVELOPMENT
The doomsayers who spent most of 2009 warning of wind market decline could not have been more wrong. Global market growth once more exceeded all expectations, accelerating from 26.6% in 2007, through 28.7% in 2008 to 32% in 2009. Not since 2002 has such a high growth rate been recorded - and at a time when the base figure was a lowly 24GW. The Windicator contains the year-end totals of operating wind power megawatts, country-by-country, for the previous year (see table below).
According to the most most recent figures, world wind reached over 159GW at the close of 2009, an addition of around 38.6GW - a 44% increase on the 27GW installed during 2008. The five-year compound annual growth rate (CAGR) moved up slightly to hit 27%. Given that the world was floundering in the aftermath of a financial sector meltdown just as the wind market needed big-time investment, the growth rates are impressive. If last year's 30% growth rate is repeated this year, the installed capacity by the end of the year will exceed 200GW.
Leading the way was Asia. For the first time, the region installed more wind than North America and Europe, which installed just under 10.5GW each. Asia hit 15.2GW. In another first, Europe was beaten by both North America and Asia as the world region installing the most megawatts annually, a position it has held since the 1980s. Its annual growth last year, however, at 15.9%, was slightly higher than the 15.3% in 2008. Europe accounted for 28% of new wind capacity in 2009, but its share of total world capacity dropped below 50% for the first time, to 48%. Asia's share is 23%, but growing strongly.
As for individual countries, China leapt ahead as the world's largest wind turbine market by far. Data released as “uåX˜äŠÊ˜·³Ç went to press says it installed 13.8GW - the most ever achieved by a country in one year. In Europe, Spain was the star performer, installing 2.4GW, followed by Germany with 1.9GW. France and Italy were the only other European countries to install more than 1GW in 2009. Across the world, 17 countries now have more than 1GW of operating wind power, with 11 of those in Europe.
ENERGY PRODUCTION
The world's 159GW of installed wind capacity at the start of 2010 is likely to produce more than 300TWh this year. The expected output from existing wind power installations is roughly equal to that of 41GW of fossil-fuel fired generation. Wind generally replaces coal-fired facilities, indicating a CO2 saving this year of about 240 million tonnes, the equivalent of taking about 40 coal power stations offline.
FEELGOOD FACTOR
After a sticky start to signing contracts in 2009 for 2010 turbine delivery, wind project developers took heart from a raft of economic stimulus measures around the world. We feel this year may be as much of a positive surprise as last, though China's growth curve could flatten.
EUROPE LEADS
Wind power capacity per person
Country Watts/
capita
1 Denmark 656.6
2 Spain 486.0
3 Portugal 353.5
4 Ireland 343.2
5 Germany 314.4
6 Sweden 175.3
7 Netherlands 140.6
8 Austria 124.4
9 New Zealand 124.3
10 United States 123.0
11 Canada 107.1
12 Greece 103.5
13 Estonia 101.4
14 Australia 97.3
15 Norway 96.9
16 Luxembourg 87.5
17 Italy 84.2
18 France 74.6
19 United Kingdom 68.7
20 Belgium 55.2
21 Falkland Islands 33.3
22 Costa Rica 31.3
23 Cape Verde 30.0
24 Finland 28.1
25 Lithuania 25.6
26 Bulgaria 23.6
27 Poland 22.4
28 China 20.1
29 Hungary 19.9
30 Taiwan 19.6
31 Czech Republic 18.8
32 Japan 16.2
33 Turkey 12.6
34 Latvia 12.1
35 India 10.7
36 Chile 10.7
37 Morocco 8.3
38 South Korea 7.7
39 Nicaragua 7.0
40 Egypt 6.2
41 Croatia 6.0
42 Tunisia 5.4
43 Uruguay 4.2
44 Mexico 3.9
45 Brazil 3.7
46 Switzerland 2.5
47 Ukraine 1.9
48 Israel 1.0
49 Iran 0.9
50 Argentina 0.8
51 Romania 0.6
52 Cuba 0.6
53 Slovakia 0.6
54 Colombia 0.5
55 Philippines 0.4
56 Jordan 0.4
57 South Africa 0.2
58 Sri Lanka 0.2
59 Peru 0.1
60 Russia 0.1
61 Ecuador 0.1
62 Bangladesh 0.01
ASIA PACIFIC CATCHING UP
Operating total wind power capacity (MW)
April 09 April 10 Extra MW Change %
EUROPE
Germany 23,903 25,777 1,874 8
Spain 16,740 19,149 2,409 14
Italy 3,736 4,850 1,114 30
France 3,387 4,538 1,151 34
United Kingdom 3,334 4,058 724 22
Portugal 2,833 3,535 702 25
Denmark 3,180 3,480 300 9
Netherlands 2,216 2,221 5 0
Sweden 1,021 1,560 539 53
Ireland 1,053 1,270 217 21
Greece 985 1,087 102 10
Austria 995 995 0 0
Poland 405 866 461 114
Turkey 383 807 424 111
Belgium 384 563 179 47
Norway 436 436 0 0
Hungary 127 201 74 58
Czech Republic 133 192 59 44
Bulgaria 158 177 19 12
Finland 143 146 3 2
Estonia 78 142 64 82
Ukraine 90 94 4 4
Lithuania 52 92 40 77
Luxembourg 35 35 0 0
Latvia 27 29 2 7
Croatia 17 27 10 59
Switzerland 14 18 4 28
Romania 10 14 4 40
Russia 11 11 0 0
Slovakia 3 3 0 0
TOTAL 65,889 76,373 10,484 16
MIDDLE EAST/AFRICA
Egypt 365 430 65 18
Morocco 134 253 119 89
Iran 67 67 0 0
Tunisia 54 54 0 0
Reunion 10 10 0 0
South Africa 9 9 0 0
Cape Verde 3 12 9 300
Israel 6 6 0 0
Jordan 2 2 0 0
TOTAL 650 843 193 30
ASIA PACIFIC
China 12,200 25,805 13,605 112
India 9,645 10,926 1,281 13
Japan 1,540 2,056 516 34
Australia 1,306 1,877 571 44
New Zealand 468 497 29 6
Taiwan 224 436 212 95
South Korea 233 364 131 56
Philippines 33 33 0 0
Pacific Islands 24 24 0 0
Sri Lanka 3 3 0 0
Bangladesh 1 1 0 0
TOTAL 25,677 42,022 16,345 64
LATIN AMERICA
Brazil 336 634 298 89
Mexico 88 415 327 372
Chile 20 164 144 720
Costa Rica 92 125 33 36
Caribbean 57 66 9 16
Nicaragua 0 40 40 -
Argentina 30 30 0 0
Colombia 20 20 0 0
Uruguay 18 18 0 0
Cuba 7 7 0 0
Ecuador 2 2 0 0
Peru 1 1 0 0
Falkland Islands 1 1 0 0
TOTAL 672 1,523 851 127
NORTH AMERICA
Texas 7,314 9,410 2,096 29
Iowa 2,810 3,669 859 31
California 2,517 2,797 280 11
Washington 1,375 1,980 605 44
Minnesota 1,752 1,812 60 3
Oregon 1,067 1,758 691 65
Illinois 915 1,546 631 69
New York 832 1,274 442 53
Colorado 1,067 1,246 179 17
North Dakota 714 1,203 489 69
Oklahoma 708 1,130 422 60
Wyoming 676 1,101 425 63
Indiana 131 1,036 905 691
Kansas 815 1,014 199 24
Pennsylvania 361 748 387 107
New Mexico 497 597 100 20
Wisconsin 395 449 54 14
Montana 272 375 103 38
West Virginia 330 330 0 0
South Dakota 187 313 126 67
Missouri 163 309 146 90
Utah 20 223 203 1,015
Maine 47 174 127 270
Nebraska 73 152 79 108
Idaho 75 147 72 96
Michigan 129 143 14 11
Arizona 0 63 63 -
Hawaii 63 63 0 0
Tennessee 29 29 0 0
New Hampshire 25 25 0 0
Massachusetts 5 15 10 200.0
Alaska 2 8 6 300.0
New Jersey 8 8 0 0
Ohio 7 7 0 0
Vermont 6 6 0 0
Rhode Island 1 1 0 0
United States 25,388 3,5161 9,773 38
Canada 2,369 3,319 950 40
TOTAL 27,757 38,480 10,723 39
WORLD 120,645 159,241 38,596 32
.png)


.png)


