1. Onshore
Onshore wind capacity became slightly more concentrated in the hands of a smaller clutch of suppliers in 2017.
More than half (50.3%) of the 48,895MW onshore capacity added last year was installed by just four companies: Vestas, Siemens Gamesa (SGRE), Goldwind and GE.
One year earlier, the top four accounted for 48.7% of new capacity.

In 2016, the top ten was behind 75.2% of all onshore wind installations, while a year later this figure increased to 78.1%.
Vestas, which retained its top spot in 2017, embodied this concentration of capacity as it increased its share of the onshore market. The Danish company installed 8,114MW onshore in 2017 as its share rose to 17.3%
Meanwhile, SGRE’s market share shot up following its merger, with its new total exceeding the combined shares of its constituent companies one year ago.
The merger also created a new space in the top ten, now filled by India’s Suzlon, which had not even made the top 15 in 2016.
When excluding China, which accounted for 39.8% of onshore installations last year, the top ten changes dramatically, FTI notes.
Vestas’ and SGRE’s market shares increase by 9.4 and 8.4 percentage points respectively, while Envision and Mingyang drop out of the top ten and are replaced by Indian suppliers Inox Wind and Regen Powertech.
Goldwind is the only Chinese supplier to have installed enough new capacity in overseas markets to be included in the top ten excluding China.
2. Offshore
A little over 5.25GW was installed offshore last year. SGRE remained the leading offshore turbine supplier in 2017, with a 46.6% market share, including the 350MW installed by the casualty of the Siemens-Gamesa merger, Adwen.

SGRE’s share is down from 66.8% in 2016 — when it was just Siemens — but it actually installed twice as much capacity than in the previous year. In 2016 less than 2GW of offshore wind was installed worldwide.
MHI Vestas (22.8% in 2017) is also beginning to regain traction in the sector on the back of its V164-8.0MW turbine, giving the industry two major players to drive competition outside of China.
Senvion, as fourth-largest offshore supplier with 8.4%, is the only other non-Chinese offshore wind supplier on FTI’s top-ten list.
The German manufacturer is struggling to make much of an impact, however, with many of the new contracts going to the two leaders.
A promise of a 10MW-plus has yet to make any discernible progress, and with GE’s gauntlet-throwing 12MW model, Senvion risks slipping further behind.
Sewind (or Shanghai Electric Wind Power), which extended its licensing agreement with SGRE earlier in March, led the charge in China, with over half the country’s market share, claiming third spot overall.
China installed more than 1GW for the first time in 2017. The market there is going to become increasingly buoyant as it targets 5GW of capacity by 2020, which could mean opportunities for western manufacturers.
GE, which did not make FTI’s top ten in 2017, installed its first turbine in Chinese waters earlier this year.
Average offshore turbine size was above 5MW for the first time, FTI said, demonstrating the rapidly growing hardware being installed, particularly in Europe.
3. Best sellers
The Goldwind GW115-2.0MW was the single best-selling turbine in 2017, the Chinese manufacturer’s mid-range direct-drive model swapping places at the head of the table with 2016’s top seller, the Vestas V110-2.0MW, almost entirely on the back of strong sales in its domestic market.
The major difference between the top-sellers in 2016 and 2017 is the shift towards higher-rated turbines with greater rotor diameters.
The only two turbines over 2MW to make the top ten in 2016 were GE’s 2.3-116 (ninth) and Vestas’ V117-3.3MW (tenth). Although the Vestas model dropped out of 2017’s top ten, the GE turbine climbed to fourth behind SGRE’s G114-2.1MW.
Other 2MW-plus machines making the grade for the first time last year were Envision’s EN115-2.2 (sixth), Goldwind’s GW125-2.5 (seventh), Suzlon’s S97-2.1 (ninth), and Enercon’s E115-3.0 (tenth). The Suzlon model was the only top ten machine in 2017 with a rotor diameter of less than 100 metres.
There were no sub-2MW turbines in 2017’s top ten, with GE’s 1.7-103 (fifth in 2016) and Goldwind’s GW93-1.5 (sixth) both dropping out of the order.
The CSIC Haizhuang HZ111-2.0 — unknown outside China — was the fourth best-selling turbine in 2016, but disappeared from 2017’s list. Mingyang’s MY121-2.0 and Envision’s 2.2MW EN115, neither of which featured in 2016’s top ten chart, appear to have filled the gap in the Chinese market.
Nordex and Senvion were the only leading European suppliers not to provide a top ten-selling turbine. Their most popular models last year were the AW125-3.0 and the 3.4M114 respectively.
4. Average size
The average turbine size installed last year hit 2.40MW, up 11.3% on 2016’s average of 2.16MW. Average rated turbine capacity has grown by over 18% in just two years, according to FTI’s figures.
This is partly due to the growing offshore market, which saw the average increase to over 5MW for the first time in 2017.
The impact of offshore wind on average turbine size can be seen mostly keenly in the UK, where the mean turbine capacity leapt from 2.1MW in 2016 to over 3.76MW last year.
But that’s not the whole story. Canada, which has no offshore capacity to speak of, saw its turbine capacity average 3.09MW in 2017, up from 2.77 in 2016.
Equally, Denmark, which failed to add any offshore capacity in 2017, saw its turbine average size grow from 2.77MW to 3.41MW.

Regionally, Europe surpassed a 3MW average for the first time — up from 2.67MW in 2016.
North America and Latin America both edged above 2.3MW, from 2.19MW and 2.28MW respectively in 2016. Meanwhile, Asia Pacific and Africa both exceeded 2MW for the first time.
5. Biggest markets
Concentration was the predominant trend in the ten largest global markets in 2017.
The top ten markets (46,774MW) accounted for 89.7% of all new capacity (52,150MW), and in nine of those markets, the top-five turbine suppliers account for more than 90% of new installations.
Only China — which last year installed more new capacity than the next three top markets combined — bucked this trend. The top five suppliers — Goldwind, Envision, Mingyang, United Power and CSIC Haizhuang — accounted for 66% of sales.
Over the next decade, however, market shares are set to become more diverse. Between 2018 and 2027, the top ten markets are forecast to contribute just over 530GW of an estimated 689GW.
This would account for about 76.9% of new capacity installed over this period — a reduction of 12.8 percentage points on 2017 concentration levels.
One explanation for this diversification could be that emerging markets’ compound annual growth rates (CAGRs) to 2027 tend to outstrip those of more established markets.
For example, the Middle East is forecast to add 10.7GW in the next ten years, at a CAGR of 52% — far ahead of the wider EMEA region (2.2%), which includes top-ten mainstays such as the UK and Germany.
Following a recent series of successful auctions, Argentina is predicted to add 7.9GW over the next decade.
And widespread interest in Taiwan’s nascent offshore market means a similar amount, 7.3GW, is forecast to be installed in the country’s waters by 2027.
6. Europe
The merger of two of the continent’s largest suppliers — Siemens and Gamesa — predictably created a new European market leader in 2017.
SGRE took 26% of European sales by capacity, just short of 4,500MW last year. But it was heavily dependent on the offshore market to make that position, installing 2,449MW in European waters last year, more than half its total.
Vestas was not far behind, though. Its onshore share of a little over 22% (3,818MW) needs to be supplemented by the 1,197MW of capacity that its offshore joint venture, MHI Vestas, installed last year.

Enercon held third place with nearly 19% (3,221MW) of European installations in 2017, most of which was in Germany, where it remains market leader.
Senvion achieved a 10.89% share of the European market last year, which equates to 1,884MW. Nearly a quarter of this (443MW) was accounted for by sales of its 6.15MW 6M126 offshore turbine.
GE took something of a tumble in 2017, its market share declining from 7.6% in 2016 to 6.21%, or 1,074MW. That looks set to improve in 2018-19 following some substantial orders in Spain and Turkey.
7. Asia-Pacific
The region saw 11,787 turbines installed last year (54.34% of the global total) for a total capacity of 24,691MW (38.02% of the global figure)
China’s newly installed capacity of 19,832MW accounted for 80.32% of the total for the region. The top three suppliers in China — Goldwind, Envision and Mingyang — were, predictably, also the top three suppliers across the whole region.
SGRE, with a 6.11% market share, and Suzlon on 5.49% were the only non-Chinese OEMs among the top ten in the region last year.

From Asia-Pacific’s top five, only SGRE appears in all top fives of the other regions: Europe, North America, Latin America, and Africa and the Middle East.
But the company’s overall share of the Asia-Pacific market has shown a slight decline since the merger came into effect, probably reflecting greater competition in the region’s second-largest market, India.
Asia-Pacific is forecast to install approximately 382GW between 2018 and 2027.
China is set to install 296GW of this — 77.48% of the region’s total or 43% of the world’s total for the period.
FTI upgraded its annual installation forecasts for China due to 2017 decreases in wind curtailment rates releasing capacity to be built in the northern territories, an improved outlook for its offshore sector, and expected strong growth in distributed wind.
The transition from feed-in tariff-based power purchase agreements to a new auction system means India is set to decline in 2018 after a record year in 2017.
However, auctioned capacities mean the market is expected to recover by 2020. It is set to install an additional 44GW by 2027.
Asia-Pacific is likely to replace Europe as the leading region in new offshore additions in 2018-2027, which is primarily due to the upgraded offshore wind forecasts for China and Taiwan. The two countries are due to install 30,500MW and 7,262MW respectively between 2018 and 2027.
8. North America
FTI Intelligence recorded 2,850 turbines installed across the US and Canada in 2017 for a total of 6,763MW, 70% of which was in the US.
The North American market last year was dominated by just four manufacturers — Vestas, SGRE, GE and the Nordex group, which together accounted for 98.6% of the region’s new capacity.
Vestas was the runaway leader on 39.9% (2,697MW) with SGRE in second place on just over 25% (1,699MW).

The US’s leading domestic manufacturer, GE, rather struggled on home ground last year, falling to third with a 22.2% (1,501MW) market share.
The US giant has improved its sales in other world markets in recent years, but its decline on its own turf, and falling behind two European OEMs, will surely be a concern for management.
GE clearly has its sights set on the anticipated growth in the US offshore sector over the next few years, but its 6MW Haliade turbine will struggle against the 8MW-plus offerings of MHI Vestas and SGRE in the short-term, before its 12MW machine reaches the market in 2023-24.
The Nordex group was fourth in 2017 with a market share of 11.4% (771MW), a 10% improvement on the previous year.
The pickings were thin across the region for other wind turbine suppliers, however. Senvion installed just 51MW in 2017, Goldwind managed 30MW, and Enercon recorded 14MW.
The combined market share of these three manufacturers last year was only 1.4%.
The US’s preference for very large clusters of wind projects, some with more than 1GW of capacity, is driving the trend towards a winner-takes-all market, with price a key component. It is hard to see the pattern changing over the next few years.
9. Repowering & decommissioning
An increasing number of turbines will be coming towards the end of their 20-year lifetimes and support contracts, FTI believes.
These early turbines are also typically located in the better wind sites. This means we can expect greater yield with more modern machines, should operators obtain the necessary local permits.
According to figures from FTI, there will be more than 1.5GW of turbine capacity reaching the 20-year lifespan in 2018.
This total is set to more than double in 2020 and reach just shy of 15GW in 2027. Over the next decade, 68.7GW of wind capacity will become at least 20 years of age.

Repowered… Enercon 7.5MW turbines towering over 300kW machines in the Netherlands
(pic: Klaas Eissens/RWE)
This represents a big repowering opportunity for the sector, theoretically doubling that capacity and tripling the output, with roughly half the number of turbines.
The potential is already on show in the US. In 2017 alone, nearly 2GW of repowering took place, mostly performed by GE. Europe will see the most capacity enter the 20-year-plus window over the next decade, with 69% of the 68.7GW.
The five European countries that will have the largest amount capacity more than 20 years old — Germany, Spain, Denmark, Italy and the UK — make up 81.5% of the region’s total, FTI found.
Most of the decommissioning in the Asia-Pacific region will be concentrated in India, where a large number of sub-1MW turbine hardware remains installed. This offers a potentially substantial gain from repowering as the country aims to reach 60GW of installed capacity by 2022.
10. Turbine technology
The high-speed geared drivetrain, the technology of choice for most leading wind turbine OEMs over the past 30 years, continues to hold the lion’s share of the global market, but its share by megawatt dropped from 73.9% in 2016 to 68.8% last year.
However, medium-speed geared turbines grew from 0.73% to 2.9% in the same period, largely as a result of MHI Vestas’s V164-8.0MW turbine entering the market in decent numbers during 2017.
The principal suppliers of direct-drive turbines are SGRE, Enercon and Goldwind.
However, SGRE’s strategy, announced in November 2017, to concentrate on conventional high-speed geared drivetrain technology for all onshore models, is likely to reduce direct drive’s share of the market in the coming years.
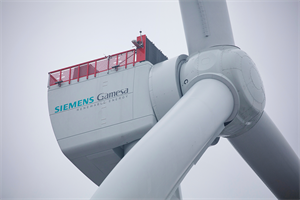
SGRE’s permanent magnet generator (PMG) direct-drive solution will now only be offered on its 6MW-plus range of offshore machines (pictured below).

Enercon, the leading exponent of electrically excited synchronous generator (EESG) direct-drive technology, appears to have strengthened its position with the acquisition of Dutch turbine maker Lagerwey.
But Lagerwey’s latest offerings follow the lead of SGRE and Goldwind in opting for the PMG direct-drive option.
It is unclear at this stage how Enercon will find synergies between the two approaches, but Lagerwey’s technology is now being adopted by Russia’s nascent wind-power sector.
As the main licensee and major shareholder of Vensys, Goldwind has built its market share on the back of the German manufacturer’s DD-PMG drivetrains.
Although Goldwind sells turbines in high numbers, making it the third-largest supplier on the global market, the overwhelming majority are installed in China.


.png)
HR.jpeg)
.png)
