More than halfway through the year, however, with updates usually dating between July and September, less than 40% of this additional capacity had been recorded.
As there is often a surge of activity during the late summer and towards the end of the year, the 47GW projection might still be realised. “uåX˜äŠÊ˜·³Ç's data and its intelligence arm, “uåX˜äŠÊ˜·³Ç Intelligence (WPI), forecast a more moderate 37.5GW for 2014, which appears likely to be hit.
More to come
One location where activity might surge is the US. Progress so far has been slow, but the American Wind Energy Association reports that 14.6GW of wind capacity is under construction. At mid-year, that is the highest figure since 2009.
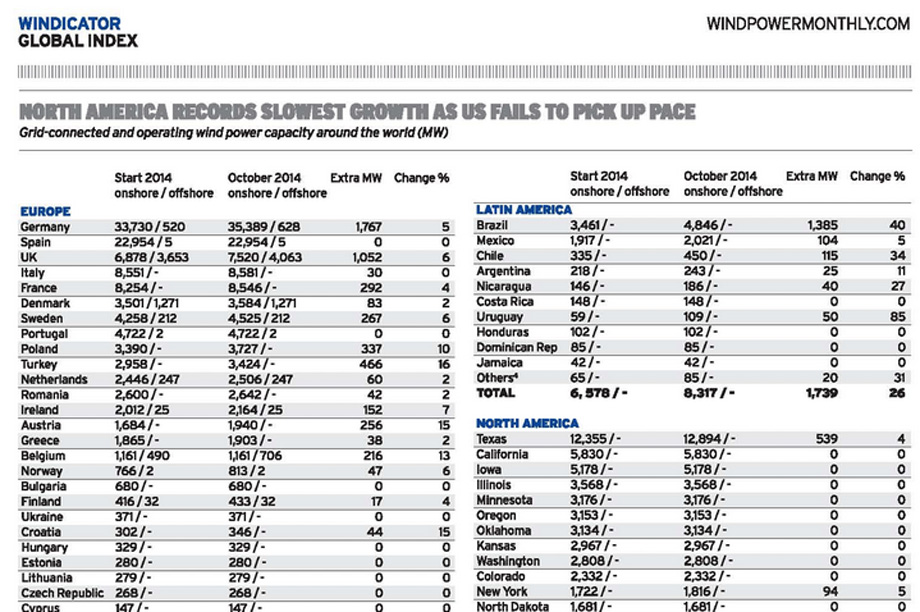
Texas continues to lead the way, with nearly 13GW installed and construction continuing rapidly. The state alone is home to more wind energy than anywhere else in the world, except Germany, Spain, China and India.
Asian growth
India, according to the country's Economic Times newspaper, plans to accelerate wind-energy development, adding an ambitious 10GW every year, or five times the total new capacity that was installed in the last fiscal year, as the government takes steps to reduce the country's dependence on costly energy imports.
China continues to be a strong performer; it has now overtaken the US and hosts the most wind of any country. Progress this year has also been strong, with 7.3GW installed so far.
European slowdown
Europe as a whole, for a long time a star performer, has slowed down, with installations so far this year well down, pro rata, below the 2013 total.
The market leader, Germany, has been doing well in comparison with 2013, but there are regulatory uncertainties that are likely to discourage the locally based energy cooperatives that have been at the heart of German wind-power development for many years.
The UK continues to move forward steadily, but not spectacularly, with regulatory uncertainties possibly contributing to a slowdown this year. However, trade organisation RenewableUK reports that 3.1GW is under construction and 11.4GW has construction consent.
Offshore
The UK continues to lead the offshore market: it has added a handful of offshore wind farms totalling nearly 500MW, and has another 576MW due online soon, as Gwynt y Mor off the Welsh coast approaches completion. Total offshore capacity in Europe is now nearly 7.2GW, with several gigawatts under construction.
The American and Chinese offshore plans are both proceeding slowly, but China may install about 500MW next year and 1GW in 2016, according to Bloomberg New Energy Finance.
Worldwide, nearly 2GW may be installed this year and about 4GW in 2015, according to the WPI pipeline.
Competition
Solar photovoltaics is still hard on the heels of wind energy, in terms of both capacity and cost. At present, global capacity is about one third of wind capacity, but 330GW of global PV capacity is predicted by 2020, according to a recent report by London-based research firm GlobalData.
If the projections for wind are realised, its capacity by that time will be around 600GW and so PV capacity will be over 50% of wind capacity.
It may be noted that both technologies are likely to have significantly more capacity than nuclear, currently around 374GW.
Although 67GW of nuclear capacity is under construction, there is no sign yet of any economic breakthrough.
A decision is still awaited from the European Commission on whether the proposed structure for funding a proposed new UK power station contravenes state sid rules.
Global wind power capacity (MW) October 2014
| Start 2014 onshore / offshore | October 2014 onshore / offshore | Extra MW | Change % | |
|---|---|---|---|---|
| EUROPE | ||||
| Germany | 33,730 / 520 | 35,389 / 628 | 1,767 | 5 |
| Spain | 22,954 / 5 | 22,954 / 5 | 0 | 0 |
| UK | 6,878 / 3,653 | 7,520 / 4,063 | 1052 | 6 |
| Italy | 8,551 / - | 8,581 / - | 30 | 0 |
| France | 8,254 / - | 8,546 / - | 292 | 4 |
| Denmark | 3,501 / 1,271 | 3,584 / 1,271 | 83 | 2 |
| Sweden | 4,258 / 212 | 4,525 / 212 | 267 | 6 |
| Portugal | 4,722 / 2 | 4,722 / 2 | 0 | 0 |
| Poland | 3,390 / - | 3,727 / - | 337 | 10 |
| Turkey | 2,958 / - | 3,424 / - | 466 | 16 |
| Netherlands | 2,446 / 247 | 2,506 / 247 | 60 | 2 |
| Romania | 2,600 / - | 2,642 / - | 42 | 2 |
| Ireland | 2,012 / 25 | 2,164 / 25 | 152 | 7 |
| Austria | 1,684 / - | 1,940 / - | 256 | 15 |
| Greece | 1,865 / - | 1,903 / - | 38 | 2 |
| Belgium | 1,161 / 490 | 1,161 / 706 | 216 | 13 |
| Norway | 766 / 2 | 813 / 2 | 47 | 6 |
| Bulgaria | 680 / - | 680 / - | 0 | 0 |
| Finland | 416 / 32 | 433 / 32 | 17 | 4 |
| Ukraine | 371 / - | 371 / - | 0 | 0 |
| Croatia | 302 / - | 346 / - | 44 | 15 |
| Hungary | 329 / - | 329 / - | 0 | 0 |
| Estonia | 280 / - | 280 / - | 0 | 0 |
| Lithuania | 279 / - | 279 / - | 0 | 0 |
| Czech Republic | 268 / - | 268 / - | 0 | 0 |
| Cyprus | 147 / - | 147 / - | 0 | 0 |
| Latvia | 62 / - | 68 / - | 6 | 10 |
| Switzerland | 60 / - | 60 / - | 0 | 0 |
| Luxembourg | 58 / - | 58 / - | 0 | 0 |
| Others (1) | 31 / - | 31 / - | 0 | 0 |
| TOTAL | 115,013 / 6,460 | 119,483 / 7,193 | 5,204 | 4 |
| MIDDLE EAST/AFRICA | ||||
| Egypt | 550 / - | 550 / - | 0 | 0 |
| Morocco | 495 / - | 545 / - | 50 | 10 |
| South Africa | 10 / - | 343 / - | 333 | 3330 |
| Tunisia | 104 / - | 243 / - | 139 | 134 |
| Ethiopia | 171 / - | 171 / - | 0 | 0 |
| Iran | 120 / - | 120 / - | 0 | 0 |
| Cape Verde | 26 / - | 26 / - | 0 | 0 |
| Others (2) | 40 / - | 42 / - | 2 | 5 |
| TOTAL | 1,516 / - | 2,040 / - | 524 | 35 |
| ASIA PACIFIC | ||||
| China | 75,155 / 325 | 82,439 / 331 | 7,290 | 10 |
| India | 20,150 / - | 21,610 / - | 1,460 | 7 |
| Australia | 3,239 / - | 3,596 / - | 357 | 11 |
| Japan | 2,661 / 21 | 2,661 / 21 | 0 | 0 |
| New Zealand | 623 / - | 623 / - | 0 | 0 |
| Taiwan | 614 / - | 614 / - | 0 | 0 |
| South Korea | 561 / - | 561 / - | 0 | 0 |
| Thailand | 223 / - | 223 / - | 0 | 0 |
| Pakistan | 106 / - | 106 / - | 0 | 0 |
| Vietnam | 52 / 16 | 52 / 16 | 0 | 0 |
| Sri Lanka | 63 / - | 63 / - | 0 | 0 |
| Others (3) | 84 / - | 84 / - | 0 | 0 |
| TOTAL | 103,531 / 362 | 112,632 / 368 | 9,107 | 9 |
| LATIN AMERICA | ||||
| Brazil | 3,461 / - | 4,846 / - | 1,385 | 40 |
| Mexico | 1,917 / - | 2,021 / - | 104 | 5 |
| Chile | 335 / - | 450 / - | 115 | 34 |
| Argentina | 218 / - | 243 / - | 25 | 11 |
| Nicaragua | 146 / - | 186 / - | 40 | 27 |
| Costa Rica | 148 / - | 148 / - | 0 | 0 |
| Uruguay | 59 / - | 109 / - | 50 | 85 |
| Honduras | 102 / - | 102 / - | 0 | 0 |
| Dominican Republic | 85 / - | 85 / - | 0 | 0 |
| Jamaica | 42 / - | 42 / - | 0 | 0 |
| Others (4) | 65 / - | 85 / - | 20 | 31 |
| TOTAL | 6, 578 / - | 8,317 / - | 1739 | 26 |
| NORTH AMERICA | ||||
| Texas | 12,355 / - | 12,894 / - | 539 | 4 |
| California | 5,830 / - | 5,830 / - | 0 | 0 |
| Iowa | 5,178 / - | 5,178 / - | 0 | 0 |
| Illinois | 3,568 / - | 3,568 / - | 0 | 0 |
| Minnesota | 3,176 / - | 3,176 / - | 0 | 0 |
| Oregon | 3,153 / - | 3,153 / - | 0 | 0 |
| Oklahoma | 3,134 / - | 3,134 / - | 0 | 0 |
| Kansas | 2,967 / - | 2,967 / - | 0 | 0 |
| Washington | 2,808 / - | 2,808 / - | 0 | 0 |
| Colorado | 2,332 / - | 2,332 / - | 0 | 0 |
| New York | 1,722 / - | 1,816 / - | 94 | 5 |
| North Dakota | 1,681 / - | 1,681 / - | 0 | 0 |
| Indiana | 1,544 / - | 1,544 / - | 0 | 0 |
| Wyoming | 1,410 / - | 1,410 / - | 0 | 0 |
| Pennsylvania | 1,340 / - | 1,340 / - | 0 | 0 |
| Michigan | 1,163 / - | 1,163 / - | 0 | 0 |
| Idaho | 973 / - | 973 / - | 0 | 0 |
| New Mexico | 778 / - | 798 / - | 20 | 3 |
| South Dakota | 783 / - | 783 / - | 0 | 0 |
| Nebraska | 534 / - | 735 / - | 201 | 38 |
| Wisconsin | 648 / - | 648 / - | 0 | 0 |
| West Virginia | 583 / - | 583 / - | 0 | 0 |
| Montana | 459 / - | 459 / - | 0 | 0 |
| Missouri | 459 / - | 459 / - | 0 | 0 |
| Maine | 431 / - | 431 / - | 0 | 0 |
| Ohio | 428 / - | 428 / - | 0 | 0 |
| Utah | 325 / - | 325 / - | 0 | 0 |
| Arizona | 238 / - | 238 / - | 0 | 0 |
| Hawaii | 206 / - | 206 / - | 0 | 0 |
| New Hampshire | 171 / - | 171 / - | 0 | 0 |
| Nevada | 152 / - | 152 / - | 0 | 0 |
| Puerto Rico | 125 / - | 125 / - | 0 | 0 |
| Maryland | 120 / - | 120 / - | 0 | 0 |
| Vermont | 119 / - | 119 / - | 0 | 0 |
| Massachusetts | 106 / - | 106 / - | 0 | 0 |
| Alaska | 62 / - | 62 / - | 0 | 0 |
| Tennessee | 29 / - | 29 / - | 0 | 0 |
| New Jersey | 9 / - | 9 / - | 0 | 0 |
| Rhode Island | 9 / - | 9 / - | 0 | 0 |
| Delaware | 2 / - | 2 / - | 0 | 0 |
| United States | 61,110 / - | 61,964 / - | 854 | 1 |
| Canada | 7,803 / - | 8,586 / - | 783 | 10 |
| TOTAL | 68,913 / - | 70,550 / - | 1,637 | 2 |
| WORLD | 295,550 / 6,821 | 313,021 / 7,561 | 17,801 | 6 |

.png)


HR.jpeg)
.png)


