Electricity generated from wind became more competitive with thermal power generation in 2010. For the second year running, prices that developers paid to build wind farms remained essentially stable, easing up very slightly to EUR1,545/kW ($2,025/kW). Prices for plants used to generate electricity from thermal sources moved up and so, given moderate stability in fossil fuel prices over the past 12 months, the competitive position of wind improved. Newly available data on nuclear costs reveal that it has lost further ground to onshore wind. This is shown in figure 1 (below), which illustrates how the generation cost of power from turbines operating in wind speeds of 7 metres per second (m/s) is getting closer to that of nuclear electricity, where average nuclear plant costs are used.
The cost of wind power generated at 7.5 m/s is below that of nuclear. Onshore wind at EUR1,545/kW at a 7.5 m/s site now comes in at EUR76/MWh ($99.6/MWh), cheaper than nuclear at EUR3,350/kW, which delivers electricity at EUR79/MWh. Wind speeds of 7-7.5 m/s are common around the world.
Wind is likely to improve its position further as last year's drop in prices for turbines results in lower costs for wind farms constructed in the months and years ahead. However, wind's future competitive position relative to coal and gas is less certain. Some authorities expect fossil fuel prices to move upwards, but the latest report from the International Energy Agency (IEA), published in November, suggests gas prices may not do so for a decade. Nevertheless, if the much lower prices of Chinese wind turbines filter through to the US and European markets, wind will gain a strong edge.
Wind plant generation costs - the sum of costs for repaying capital charges for the installation, plus operations and maintenance (O&M) costs and other miscellaneous expenses - have been calculated from reported costs for a collection of new plants with a combined capacity of more than 3GW.
Nuclear project costs are harder to pinpoint because so few plants have been completed in recent years. However, it is possible to derive nuclear generation costs from detailed analyses of projected installation costs published over the past year.
A clear distinction must be drawn between installed costs, which are largely similar worldwide, and generation costs, which depend critically on national institutional frameworks. Projects in countries that offer fixed prices for energy, known as feed-in tariffs (FITs), are seen by developers and financial institutions as bearing relatively low risk. Hence, these can be financed at rates of return of 5-8%, applied to a project's cost as a whole. Sites where energy prices are not guaranteed are seen as riskier, and lenders and investors demand higher rates of return that can exceed 12%.
Onshore wind costs
We calculate an average onshore wind farm cost of EUR1,545/kW ($2,025/kW) in 2010, excluding small projects below 10MW. This figure was a fraction higher than 2009, although the difference is not statistically significant. The spread of costs was smaller than in previous years and two thirds of projects were between EUR1,400/kW and 1,700/kW. The IEA data suggests a similar average cost. The average derived from IEA figures for onshore wind was $2,115/kW, with the cheapest costs being reported by China: $1,223/kW. The most expensive was in the Czech Republic, at $3,280/kW, (see figure 2).
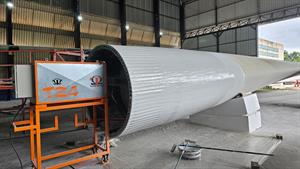
Wind turbine costs account for roughly two thirds of total onshore wind project costs. The average price charged by several manufacturers was just under EUR1,000/kW, representing the second consecutive annual drop after a 2008 peak. There is little variation among European manufacturers, but recent data suggest that prices for wind turbines manufactured in China fall under EUR500/kW and that European manufacturers are selling into the Chinese market at around EUR570/kW. This no doubt explains why the cost of Chinese wind farms reported by the IEA is as low as EUR880/kW.
Figure 3 illustrates the trends in turbine prices and wind farm costs since 2004. The gap probably widened because many turbine contracts for recently completed wind farms were placed around 2008 - before prices started to fall. As the slightly lower prices observed since that time feed through into installed wind farm costs, the latter may also fall slightly. Although it is possible to realise economies of scale by building very large wind farms, these benefits are often offset by such factors as higher construction costs at remote and hilly sites.
Offshore wind
At first sight, there might appear to be a wide range of installed costs for offshore wind. But the Danish Energy Agency notes that the most expensive projects are for demonstration purposes. The agency suggests a cost range of EUR2,300-EUR3,800/kW. The upper range excludes expensive demonstration projects. The US Department of Energy cites a cost of EUR2,500/kW, while two independent British studies estimate costs of EUR2,900-EUR4,000/kW. The choice of an appropriate range is therefore subjective, but the majority of recent and near-term projects are expected to see installed costs between EUR2,700/kW and EUR3,300/kW.
Thermal
The rise in construction costs reported for all types of thermal plants over the year saw combined-cycle gas-turbine plants generally range between EUR730/kW and EUR940/kW, coal plants with flue gas desulphurization at between EUR1,600/kW and EUR2,300/kW and nuclear plants at EUR2,700-EUR4,000/kW. Coal prices were fairly stable and gas prices eased slightly.
But there are wide variations in the price of gas, with US prices roughly half those in Europe. For years, US gas prices tracked those for oil, but US gas prices have now dropped while its oil prices rose. The US Energy Information Administration expects a steady rise in the price of gas for electricity generation in coming years.
Gas-fired generation is currently the cheapest option of all. Prices range from EUR38/MWh ($50/MWh) in the US to about EUR64/MWh in parts of Europe where gas is significantly more expensive (figure 4). When carbon costs of EUR30/tonne of CO2 is added to these figures, the premium is about EUR12/MWh. Despite hopes across the renewables sector for a EUR30/tonne carbon price under the EU Emissions Trading System (ETS), the current EU ETS price is around EUR15/tonne.
The price of coal, based on the energy content, is cheaper than gas, but the electricity that coal produces is more expensive. So the global range for the cost of power from coal is about EUR48-76/MWh. In regions where carbon penalties are applied, about EUR24/tonne must be added to that cost.
As shown in figure 2, estimates for capital cost at nuclear power plants range from a low of $2,300/kW in China to a high of $5,858/kW in the Czech Republic. The range used for our generation cost estimates is EUR2,700-EUR4,000/kW ($3,537-5,240/kW) and excludes the outlying values. Among figures not included is an upper limit of EUR5,080/kW in UK Electricity Generation Costs Update, an analysis by consultants Mott Macdonald for the UK Department of Energy and Climate Change.
A difficulty with nuclear costs is that because so few plants have been built in Western Europe and the US recently, financing institutions are likely to require a so-called risk premium to account for possible cost overruns. This is standard practice with any large-scale capital-intensive project; a UK government White Paper in 1995 suggested that the weighted average cost of capital for nuclear might be about 3% higher than for gas-fired generation. There have been similar findings since then. Alternatively, financiers may demand that nuclear developers add a significant contingency to capital cost estimates. Either way, the risk to which lenders and investors are exposed is reduced, since these additional costs are reflected in prices electricity consumers pay for nuclear electricity.
Whichever procedure is used adds about EUR14/MWh to generating costs of nuclear electricity. This is reflected in the risk allowance shown on the cost comparison graph. The low end of the range of nuclear generation cost is EUR58/MWh, excluding the risk premium. It can rise as high as EUR101/MWh when the premium is included.
Generation costs
Figure 4 shows that onshore wind installed at EUR1,400/kW - towards the low end of the current range - and financed over 20 years at an interest rate of 8% delivers electricity to the power network at just over EUR100/MWh at a site where the mean wind speed is 6 m/s. The figure falls to about EUR77/MWh with a 7 m/s wind speed site and EUR50/MWh at a site where the mean wind speed is 9 m/s. Above 7 m/s, these prices are competitive with gas at the upper end of its generation cost range, assuming a carbon cost of EUR30/tonne of CO2. These wind prices overlap coal and nuclear prices. Gas and coal are cheaper at the lower end of their price ranges, but wind above 7 m/s is cheaper than at the upper end of their price ranges.
At the top of onshore wind's installed cost range, EUR1,700/kW, wind generation costs are around EUR97/MWh at 7 m/s, falling to EUR69/MWh at 8.5 m/s and EUR58/MWh at 9.5 m/s. Wind at such installed cost is only competitive with the higher end of gas prices at wind speeds above about 8 m/s. Wind at EUR1,700/kW is still competitive with nuclear unless a developer has been able to build a reactor at the lowest possible cost. If coal comes in at the lower end of its price range, around EUR48/MWh, and there is no carbon cost attached, it is competitive with highcost wind. But wind above about 7 m/s is cheaper than coal with carbon costs at the upper end of its price range.
Offshore wind
Offshore wind generation costs at EUR2,700/kW and at a wind speed of 7 m/s are around EUR182/MWh, falling to EUR158/MWh at 7.5 m/s and EUR125/MWh at 8.5 m/s. At EUR3,300/kW, they are around EUR161/MWh at 8 m/s, falling to EUR133/MWh at 9 m/s. An example supporting the generation cost estimates comes from the published electricity price of EUR140/MWh at Denmark's Anholt wind farm.
A study carried out by the UK Energy Research Centre suggested a slightly higher average price of EUR165/MWh. Only at high wind speeds and/or low installation cost can offshore wind compete with thermal sources of electricity generation, although the low end of the offshore wind generation cost range comes near the upper end of the nuclear cost range. Future wind farms far out in the North Sea, where wind speeds are around 10 m/s, may begin to compete with nuclear generation.
Sensitivities
Generation cost estimates in figure 4 assume an 8% interest rate and a 20-year maturity for capital investment loans. Such pay-back periods are common among banks and utilities. However, plant lifetimes are mostly longer than this. The IEA derives generation costs on the assumption that most thermal and wind plants will operate between 25 years and 60 years.
Increasing the depreciation period for nuclear from 20 to 60 years would bring down the generation cost by about EUR14/MWh, making it significantly more competitive. It remains to be seen whether this is realistic, as few reactors have operated for that long (“uåX˜äŠÊ˜·³Ç, June 2005). It is unlikely lenders would countenance repayment periods of this length.
Changes in the interest rate have a more dramatic effect on generation costs. According to the IEA, nuclear costs in China, with an interest rate of 5%, may go as low as EUR21/MWh; the corresponding figure for Chinese wind is EUR36/MWh. But nuclear costs can go as high as EUR98/MWh in Switzerland, with an interest rate of 10%. Onshore wind there costs as much as EUR166/MWh.
The future
Most analysts are cautious about projecting wind power costs, due to fluctuations in commodity prices influencing installed costs in recent years. A modest drop of 10-15% in onshore costs is anticipated, provided prices for commodities used in wind turbines and wind farms - such as steel - remain stable.
This trend will be accelerated by continuing improvements in wind turbine design and strong competition from Chinese wind turbines. Future offshore cost trends are difficult to predict, as the industry has developed fairly slowly so far. But as the sub-sector heats up, some analysts expect a 20% drop in installed costs that would bring electricity from offshore wind more in line with that from thermal sources - particularly if fossil and nuclear fuel prices rise.
INTEREST RATES CALCULATING THE AVERAGE COST OF CAPITAL
Most wind farms are financed using a mixture of loan and equity. The returns expected by equity investors are generally higher than the interest rates demanded by banks. Returns and interest rates can be combined into a weighted average cost of capital (Wacc). This is numerically equal to the test discount rate. If, for example, a bank loan covers 50% of total project cost at an interest rate of 3% - factoring out inflation - and equity investors target of a 13% rate of return on their ownership stake, then Wacc is a simple average of the two figures, or 8%. In practice, bank loans may account for up to 80% of the project cost, resulting in a Wacc that leans towards the debt figure.
A wind power project financed wholly by a developer using its own resources is termed off-balance-sheet financing. Even in this circumstance, the developer will have a target rate of return.
The International Energy Agency calculates generation costs using two Waccs, 5% and 10%. This range covers most of the levels used in practice today. Many utilities in mainland Europe target Waccs between 5-7%, but those in the UK and US tend to use higher levels of up to 10%. Our analysis (see main story) uses an interest rate, numerically equal to the Wacc of 8%, which is roughly in the centre of the range found across the power-generation industry.
THE REAL COST OF NUCLEAR DECOMMISSIONING AND SPENT-FUEL COSTS
Nuclear decommissioning costs influence the relative competitiveness of major energy sources. Enormous sums of money are involved and much time is needed to dismantle a nuclear reactor. For most modern reactor types, the costs are around EUR400/kW ($524/kW), according to the World Nuclear Association, or about 15% of construction costs, according to the International Energy Agency. The two estimates are similar.
There are several ways of making provisions for this. Perhaps the most common is a so-called sinking fund - a ring-fenced sum of money set aside annually from sales of nuclear energy. Even if the money only earns a modest rate of interest, the fund is designed to accumulate substantially over 60 years. This analysis assumes a decommissioning payment of EUR2.4/MWh, in line with the value used by consultants Mott MacDonald in a recent report - UK Electricity Generation Costs Update - for the Department of Energy and Climate Change.
With 1% interest, this will accrue to just over EUR1,000/kW over 60 years, or roughly 25% of the initial cost. This figure, in principle, includes all the costs of disposal of spent fuel. Much controversy surrounds this, because there are few potential sites for long-term storage facilities in the world. Proposed sites in the US and UK have recently been ruled out.
Complicating matters further, waste management in Britain is currently managed by the government, so it is debatable whether full costs are paid by the nuclear industry and reflected in generation costs regularly appearing in industry analyses. In future, the industry is expected to pay a fee to the Nuclear Decommissioning Authority.
Wind energy developers must also set aside money for decommissioning, although these sums are typically only around 5% of the initial cost.

.png)

.png)
