It is likely to take several months, preferably a year, until this potential can be established with some accuracy.
Once it is determined, however, estimation of the energy yield of the wind farm is a reasonably straightforward process that takes into account the characteristics of the chosen wind turbines, the wake losses, electrical losses on the site and the expected availability of the turbines.
Relevant wind speeds
Site wind measurements are absolutely essential.
Very few wind farm sites are absolutely flat and sufficiently close to a meteorological (met) station, such as an airport, that will have taken regular measurements of the wind to be able to determine the relevant wind speeds from their observations.
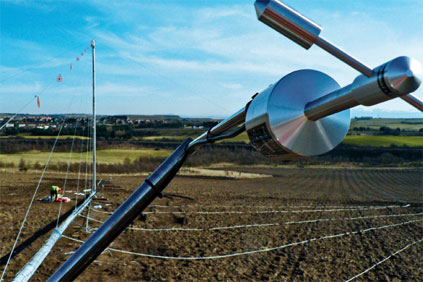
The standard procedure is to install a met mast (30-40 metres high) on which anemometry is fixed to measure wind speeds.
 However, as turbines continue to grow, raising tall masts to monitor wind speeds at the height of a turbine hub is becoming increasingly, and prohibitively, expensive.
 With larger turbines, it is becoming more usual to monitor wind speeds at, say, 10-metre intervals up to about 40 metres.
From this, speeds above mast height can be extrapolated. Alternatively, remote-sensing techniques, such as lidar and sodar (light and sonic detection and ranging), can be used.
The anemometers will measure average hourly wind speeds, which are then compared with measurements from the reference met station.
The measure-correlate-predict technique (see below) is then used to match the data from the met station and the site to estimate the long-term wind speed at the location of the anemometer.
The position of the mast for the anemometers should be chosen to ensure a reliable — not necessarily the average — estimate of wind speed.
So, to avoid high turbulence, the preferred placing is on terrain that is reasonably smooth. Software that establishes the flow of the wind is then used to determine the pattern of wind speeds over the site and at the proposed turbine locations.
Long-term average
Because the average wind speed varies annually, the next step is to establish the long-term average speed for the met station and then calculate the expected long-term wind speed and its variability for the proposed wind farm site.
This is important because, if the site potential was based on measurements that were taken at the met station during a year with above-average wind speeds, the long-term wind-speed predictions would be too high.
For example, average annual wind speeds at a London airport over a 14-year period varied quite significantly between 3.1 and 4.6 metres/second (m/s), finally producing an average of 3.8m/s.
The final stage of the analysis involves determining the wind speed distribution at the proposed site by applying the correlation equations that have been derived to the wind speed distribution at the reference met station.
The example (right) shows that wind speed is 7.5m/s for 11% of the time and the mean wind speed is calculated at 8.4m/s.
The electricity-generating potential of the site can then be estimated by combining the wind speed distribution with the power characteristics of candidate wind turbines.
Power characteristics show the relationship between wind speed and turbine output.
Wake and terrain effects
Three more factors need to be taken into account before the overall productivity of a site can be established — wake effects, terrain effects and internal electrical losses.
Sites are rarely flat and wind variation in response to the undulations needs to be taken into account. Sophisticated flow-modelling software can demonstrate the movement of wind around the site and so establish the actual wind speeds likely to be experienced by each turbine.
It can also extrapolate from the height of the anemometer to the hub height of the turbines and calculate how much the wake of wind turbines upstream might affect the output of others.
The positioning of wind turbines involves a number of trade-offs.
If they are too close together, wake effects will be high, bringing unacceptable energy losses of 10% or more. Generous spacings will minimise this but increase build costs with more access roads, plus more electrical cabling, which costs more and will increase electrical losses.
There are sophisticated software packages that carry out the analysis and aim to deliver an optimised wind farm layout in accordance with the requirements of the developer. Examples include Windfarmer from Garrad Hassan, and a number of packages from AWS Truepower and Natural Power.
These also include the all-important estimates of the accuracy of the energy predictions.
Assessing the uncertainty
Total accuracy is rarely achievable in any scientific analysis and lending institutions invariably ask for a measure of the uncertainty in estimates of energy yield.
This uncertainty arises from the correlation procedure, the long-term wind speed, the flow modelling and turbine power curves. Each may be modest but their combined effect can be significant.
In most proposed wind farms, this uncertainty is handled by qualifying the "probability of exceedance". The P50 energy yield is the yield for which there is a 50% likelihood that it will be exceeded; the P90 figure represents a 90% likelihood it will be exceeded.
The latter is more attractive to a financier and is often about 15% lower than the P50 figure.
Putting it all together
The path used to calculate the energy production that is likely to be delivered by a wind farm depends on whether specialist software is used but the factors that need to be taken into account are summarised in the table (below) and relate to a fictitious wind farm.
Explicit calculations of wake losses may not, for example, be made, but they are there, nevertheless.
The various sources of uncertainty combine in such a way that the P75 yield is typically about 5% lower than the P50 yield, with P90 around 15% lower.
If the site is particularly complex or if the met station data are not considered very reliable, a lender might insist the economic calculations be based on the P95 value, which is even lower.
One other consideration that is sometimes expressed by potential investors or other interested parties is that global warming could lead to changes in wind strengths, and possibly to a decline in future years, however far off.
Consultants Garrad Hassan have examined the data available in Northern Europe and concluded that there is little evidence of this, although the availability of reliable long-term data is a drawback.
Using these calculations, it is possible to estimate the potential energy yield of a site with some accuracy, and to determine its optimum layout.
THE ENERGY VARIABLES CHECKLIST
Determining the energy yield of notional wind farm
| Property | Typical value | Data source | |
| Met station average wind | 7m/s | From owner | |
| Average variation | 0.7m/s | From owner | |
| Site wind average | 8m/s | Site measurements | |
| Correlation uncertainty | 0.5m/s | Statistical analysis | |
| Anemometer calibration error | 1% | Manufacturer | |
| Flow modelling uncertainty | 2% | Software provider | |
| Energy yield | 20GWh | Turbine power curve | |
| Availability | 96% | Manufacturer | |
| Wake losses | 3% | Computer analysis | |
| Electrical losses | 1.50% | Calculation | |
| Net yield P50 | 18.34GWh | Statistical analysis | |
| Net yield P75 | 17.45GWh | Statistical analysis | |
| Net yield P90 | 16.6GWh | Statistical analysis | |
MEASURE-CORRELATE-PREDICT CALCULATING SITE WIND FROM ANOTHER SOURCE
The measure-correlate-predict (MCP) approach is based on taking a series of wind measurements at the proposed wind farm site and correlating them with simultaneous wind speed measurements that have been taken at a meteorological (met) station nearby.  Concurrent wind measurement should be made at the on-site met mast for at least one year, determining the wind speed distribution in 12 sectors of 30 degrees.
Concurrent measurements from the met station and the wind site are then compared, enabling a relationship to be established between wind speed distribution at the site and measurements at the reference station.
The diagram (above) shows typical data from a site met mast that has been correlated with data from a nearby met station.
The blue line shows the ‘best-fit’, and the statistical analysis software produces an equation to link the two (in this case site wind = 0.838 + 1.09 x met station wind speed).
So when the met station wind speed is 10 metres/second (m/s), the wind speed at the proposed site will be 11.7 m/s. The proximity of the red data points show a good match of the data, resulting in a correlation coefficient of 0.935.
.png)


.png)


