In 2019, wind overtook hydro to become the largest source of renewable energy in the US. The 105,591MW that were operating at the end of the year, generated 300TWh, contributing 7% to the country’s electricity supplies.
The corresponding figures for utility-scale solar PV were 45,761MW of capacity, 72TWh generation, accounting for 2% of electricity supplies. In addition, there was 15,853MW of residential solar PV and 14,330MW of commercial PV.
The costs of utility-scale solar PV are falling very rapidly, as shown in the cost comparison graph — below, left — based on data from reports by the Lawrence Berkeley National Laboratory. The wind report was reviewed in the October issue, and the solar report was published shortly afterwards. This suggests that, on average, large-scale solar PV is about to undercut wind energy costs.
Dramatic fall
The costs of energy from PV have fallen dramatically over the past ten years, from $226/MWh in 2010 to $45/MWh in 2019. As with wind, this was due to a combination of lower capital costs, higher capacity factors and lower operation and maintenance (O&M) costs.
Berkeley Laboratory’s estimate of the average cost of wind energy in 2019 was $36/MWh, but the gap is narrowing rapidly.
The data shown in the cost comparison graph, below, show overall averages and there are significant variations about the mean. The 2019 estimates for PV, for example, range from $28/MWh to $105/MWh. These variations are due to differences in construction costs, to the level of solar radiation and also to project size. Economies of scale have a strong influence on installed costs and large projects can be built at lower cost.

For wind, the average cost of projects with a capacity of less than 5MW was $3,766/kW, while the largest projects, with a capacity of more than 200MW, were built for $1,412/kW. The overall average for wind was $1,436/kW.
The average cost of all PV projects was $1,440/kW, but the largest projects, with a size range 100-200 MW, were built for $1,120/kW.
Productivity
Although the average installed costs for PV and wind were very similar, the productivity — measured by the capacity factor — of PV was only a little over half that of wind (see chart below).

O&M costs for PV were lower than those for wind, which partially offsets the lower capacity factor, meaning the cost of energy is only slightly higher than that of wind. As the cost of energy from PV is falling faster than that of wind, it seems likely that PV will start to undercut wind fairly shortly.
One of the factors that will influence the rate at which the costs of energy fall is how quickly the technologies continue to develop.
Forecasts
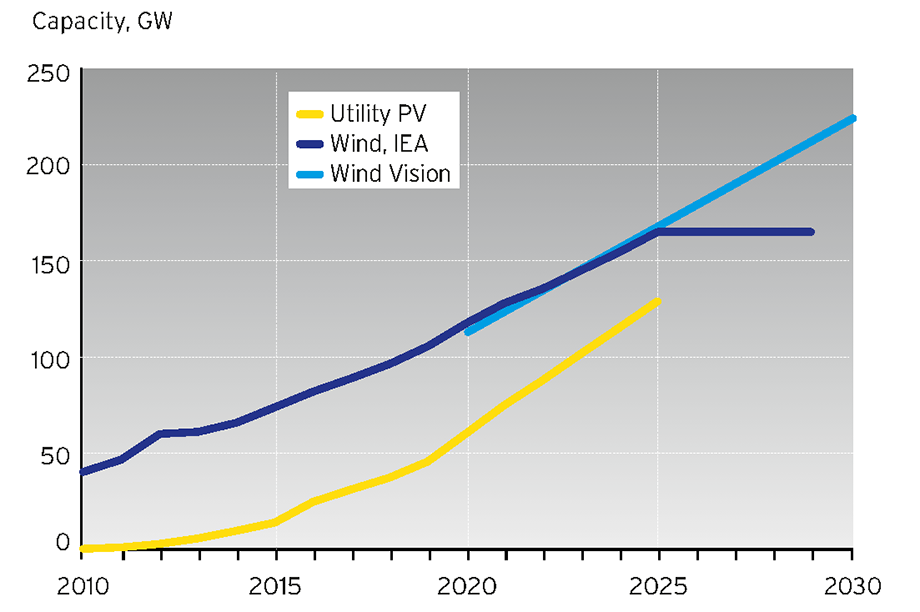
The Berkeley Lab PV report includes a projection up to 2025, when utility-scale PV may reach 129GW. This does not include commercial and residential-scale PV which, by that time, could reach 63GW.
The corresponding report for wind did not include a projection, so two estimates are shown, one from the US Department of Energy’s (DoE) Wind Vision report, and one from the International Energy Agency’s Renewables 2020 report. These two reports give very similar estimates, suggesting wind capacity will reach 165GW by 2025, and the DoE suggests capacity will reach 224GW by 2030.

The DoE Annual Technology Database suggests the levelised cost of onshore wind will only fall slowly in the years ahead, but solar PV, by contrast, continues to fall
At a glance This month’s report conclusions
Wind energy technology data update: 2020 edition, Wiser, R et al, Lawrence Berkeley National Laboratory, August 2020 Review of the latest developments in wind energy technology in the United States up to 2019. Information on costs, wind turbine characteristics and other aspects, most of which is generally applicable, worldwide
Utility-Scale Solar Data Update: 2020 Edition, Bolinger, M. et al, Lawrence Berkeley National Laboratory, November 2020 Comprehensive review of progress and performance of utilty PV, similar to wind report above slowly until about 2030
.png)


.png)