This all-time high expansion benefitted from offshore wind becoming cheaper than new-build gas, nuclear or coal-fired plants, the industry body claimed.
There is also the availability of increasingly powerful turbines being installed farther from the shore and in deeper waters, WindEurope noted in its annual offshore wind report.
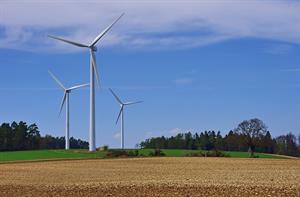
Ten new offshore wind farms were commissioned in five European countries last year.
The 3,627MW of new capacity is below the minimum 7-18GW annual additions needed to meet the ambitions outlined in the European CommissionŌĆÖs Green Deal.
| Country | New Offshore Wind Capacity |
| UK | 1,764MW |
| Germany | 1,111MW |
| Denmark | 374MW |
| Belgium | 370MW |
| Portugal | 8MW |
There is currently 22.1GW of installed wind capacity in Europe with a long way to go to reach the 450GW in the EC forecast.
To meet this target, 7GW of new offshore wind would need to be added every year until 2030, and then 18GW per year until 2050 ŌĆö an ambition WindEuropeŌĆÖs CEO Giles Dickson described as ŌĆ£doable and affordableŌĆØ.┬Ā
A forthcoming EU Offshore Wind strategy, due later this year, should ŌĆ£map out clearly how to mobilise the investments needed for 450GWŌĆØ, Dickson added,
ŌĆ£It should provide a masterplan to develop the offshore and onshore grid connections and to get the maritime spatial planning right.
ŌĆ£This will require ever closer cooperation between Governments in the North Sea and the Baltic. And this should also include the UK ŌĆö they were half of EuropeŌĆÖs investment in offshore wind in the last decade and will remain by far the biggest market," he said.
Costs
Offshore wind strike prices continue to fall significantly in auctions, but permitting challenges and projects in new markets have pushed up financing costs in some cases.
Projects were awarded in tenders in the UK, France and the Netherlands with prices between Ōé¼40-50/MWh ŌĆö cheaper than the prices needed for new gas, coal or nuclear, WindEurope claimed.
However, capital expenditure for projects that reached a final investment decision (FID) increased per megawatt.
Four wind farms reached FID in 2019, with Ōé¼6 billion of total investments made in 1.4GW of capacity ŌĆö or Ōé¼4.28 million/MW.
By comparison, Ōé¼10.3 billion of total investments were made in 2018 for 4.2GW of new capacity ŌĆö or Ōé¼2.45 million/MW.
WindEurope noted that 2019ŌĆÖs most expensive offshore wind farm was the┬Ā480MW Saint-Nazaire , priced at Ōé¼5 million/MW.┬Ā
It is FranceŌĆÖs first offshore wind farm and has been delayed due to permitting challenges and renegotiation of tariffs, reducing the impact of cost reductions.
Bigger, farther, deeper
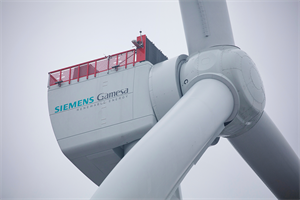
Offshore wind turbines continued to get more powerful in 2019, the industry body noted, with an average rated capacity of 7.8MW ŌĆö 1MW more powerful than the average one year earlier.
On average, turbine power rating has increased by 16% every year since 2014, according to WindEurope.
This trend looks likely to continue.
MHI Vestas is preparing to deliver a 9.5MW turbine ŌĆö 900kW more powerful than the current largest commercial, grid-connected turbine in European waters ŌĆö at Belgian and Dutch sites in 2020, while GE installed a 12MW prototype at an onshore test site last year.

Average size of commercial offshore wind farm projects in the year (MW)
New offshore wind farms are also, on average, bigger, farther from the shore, and in deeper waters, according to WindEurope analysis.
Offshore wind farm size has nearly doubled from 313MW in 2010 to 621MW in 2019.
Again, this looks likely to continue, with the┬Ā714MW East Anglia ONE ▓╣▓į╗Õ╠²1218MW Hornsea Project One projects ramping up production in UK waters.

Rolling average water depth of online offshore wind farms
New projects were also built farther out to sea and in deeper waters.┬Ā
WindEurope uses ŌĆśrolling averagesŌĆÖ of three years for water depth and distance to shore.
ŌĆ£A rolling average is the calculation of successive averages of different data subsets to identify long-term trendsŌĆØ, it explained.

Rolling average distance to shore of online offshore wind farms
On average, new offshore wind farms were built 59km from the shore ŌĆö up from 35km in 2018 ŌĆö and in water depths of 33 metres ŌĆö up from 30 metres a year ago.

.png)


.png)


