For several years, these reviews have noted that wind — on good sites — was becoming increasingly competitive with the fossil-fuel sources.
However, 2018 was a turning point, with several respected bodies concluding that the costs of wind-generated electricity had reached a point where wind energy could be viewed as a mainstream generation technology.
To underscore this, further plans were announced for subsidy-free wind energy projects in various parts of the world.
This changed perception of wind energy did not happen overnight, of course. Our cost comparison chart (below) shows onshore wind is now cheaper than gas over most of the range of wind prices.
Wind can compete with gas and coal, even on only moderately windy sites, in an increasing number of locations.
There may be regions were cheap gas or coal is available and the fossil sources are cheaper, but their number is ever dwindling.

These estimates of nuclear, fossil-fuel and renewable-energy generation costs reveal the competitiveness of onshore wind. Note that the minimum and maximum values are indicative of the "low end" and "high end" prices and that lower and higher values can be found.
Principal source: Energy Information Administration, US Department of Energy. March 2018. Levelized Cost and Levelized Avoided Cost of New Generation Resources in the Annual Energy Outlook 2018, plus data from other sources and author’s estimates.
The chart includes a figure for the "fuel saving" value of wind (from the EIA report). This is a more stringent yardstick than the total generation cost.
Onshore wind became cheaper than nuclear several years ago and, more recently, offshore wind has also started to undercut nuclear.
Wind’s principal competitor is now solar photovoltaics, where prices are falling more rapidly than those of wind.
In some places, PV can now beat wind on price, particularly where solar insolation is high and wind speeds are low.
Competition from other renewables is limited to locations where hydro can be easily developed or where high-temperature geothermal steam, close to the surface, can be economically exploited.
Growing investor confidence has also helped make wind ever more competitive. This translates to a lower weighted average cost of capital (WACC), often referred to as the interest rate.
The WACC used for wind has come down in recent years, partly because interest rates in the financial sector have generally fallen, and partly because investors view wind as increasingly reliable, and therefore less risky.
Lower risk means less interest is charged for debt, and equity investors lower their requirements for rates of return. The WACC is simply the weighted average of the two interest rates.
Lower interest rates have a much greater impact on the costs of energy from wind and solar than on gas-fired generation, for example, since a much higher proportion of the total cost of generation is due to the capital repayments (with interest).
A recent review of interest rates used in the market by accountants Grant Thornton revealed that rates used for onshore wind were mostly in the 5-7% range, but those for PV projects were typically 0.25-1% lower.
This probably reflects the fact that PV installations have no moving parts and are therefore viewed as less risky.
Offshore wind was subject to interest rates around 1.5% higher than for onshore wind — no doubt reflecting a perceived higher risk.
Calculating levelised costs of energy
Capital costs are the most important parameters in the case of the renewable-energy sources. For onshore wind, the minimum this year may be taken as $1,100/kW.
This reflects the weighted average for India quoted in the Renewables 2018 Global Status Report by renewable-energy policy network REN21.
The overall average may be taken as $1,550/kW. This is slightly lower than the average quoted by the Lawrence Berkeley National Laboratory’s Wind Technologies Market Report 2017, which did not reflect a $100/kW reduction in turbine costs between 2016 and 2017 in total project costs.

The upper boundary has been taken as $2,000/kW, to give a symmetrical spread about the mean.
This is in line with the weighted average for Europe quoted by the Renewables 2018 Global Status Report.
The weighted average cost of capital for onshore wind has been set at 6% and the amortisation period at 20 years.
This is the duration of several recently awarded contracts for difference, although a few run for shorter periods (15 years in the UK).
In July, a 29-year power purchase agreement — believed to be the world’s longest contract for wind power — was signed by Norwegian aluminium company Norsk Hydro to buy the power from a 235MW wind farm to be built in Sweden by December 2019.
Less data is available for offshore wind, but the minimum installed cost can be set at $2,200/kW, based on a paper published by the Yale School of Forestry & Environmental Studies.
An approximate average is $4,000/kW and, again in the interests of symmetry, the upper bound can be set at $5,800/kW.
These figures are difficult to quantify, partly because of the shortage of data and partly because any averages are skewed by the high prices from the relatively immature US market.
The National Renewable Energy Laboratory’s Annual Technology Baseline quotes installed costs for floating wind turbines that range up to $8,200/kW, but these have not been taken into account.
The weighted average cost of capital for offshore wind has been set at 7%, and the amortisation period, as for onshore wind, at 20 years.
With these assumptions, estimates of generating costs are shown in the chart below.
For offshore wind, at the average installed cost of $4,000/kW, the figure is $166/MWh with a wind speed of 8m/s, falling to $127/MWh at 9.5 m/s. At $5,800/kW, energy prices are about 38% higher.
It is only at the minimum price of $2,200/kW that the prices come within the fossil-fuel price range. A typical value, at 8m/s is $100/MWh.
Although an interest rate of 7% has been used for these calculations, lower values may be possible in some locations.
The Fraunhofer Institute, for example, suggested a weighted average cost of capital of 4.8% in its recent report on the levelised cost of electricity, which would bring the generation cost at 8m/s down to around $86/MWh.
For onshore wind, the estimated generation costs, based on the assumptions set out above, are below $100/MWh for wind speeds above 6m/s.
At the high end, with installed cost of $2,000/kW, the generating cost is $67/MWh at 7.5m/s. The corresponding figure at the median price ($1,550/kW) is $51/MWh, and that comes down to $36/MWh with installed cost of $1,100/kW.
Using lower interest rates brings prices down further: the Fraunhofer Institute applies an interest rate of 2.5%, which puts energy costs at the mid-range installed cost roughly down to the level of the low-end costs shown here.
How prices compare with the fossil sources
The estimated cost of coal with 30% carbon capture and storage (CCS) has increased by 30% since last year, according to the US Energy Information Administration, and the technology is not expected to be available until 2022 in any case.
The true additional costs of carbon capture and storage are still uncertain and experience of the technology remains limited.
The lower price for nuclear at $85/MWh has come down slightly since last year, while the upper price ($130/MWh) reflects the contract price for a new power station now under construction in the UK.
The minimum price for gas is $44/MWh, which applies in the US, but prices tend towards the high end of the range (around $78/MWh, excluding carbon costs) in Europe.

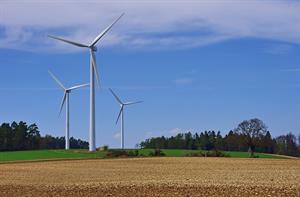
Fossil fuels… Gas is now more expensive than onshore wind in most regions (pic: Martijn Ooms)
The wide range of estimates for PV comes from the US.
Historically, installed costs for PV have been significantly higher in the US than in Germany, but the similarity between the current minimum cost of energy in the two countries suggests that there may now be some convergence.
As there is still no consensus on a universal carbon price, a value of $10/tonne of CO2 has been used, adding around $4/MWh to the price of gas and $9/MWh to the price of unabated coal.
Stiff competition from solar
The close similarity between the minimum PV and wind prices in the cost comparisons suggests that solar is now becoming increasingly competitive with wind.
However, to suggest either source is cheaper is an oversimplification as the location is crucial in each case.
The maps (see below) show the distribution of wind and solar resources across the globe. Some of the best wind resources are to be found in the centre of the US, in particular in the Rocky Mountains, and the north-east coast, as well as the southern tip of South America.
Across the Atlantic, the best wind resources are in northern Europe, the west coast of north Africa, the Horn of Africa, and the southern tip of Africa. South-west Australia also enjoys good wind resources.
Solar resources are not, as might be expected, evenly distributed either side of the equator.
The best resources are in the southern US and Mexico, most of the coastal regions of Chile, most of Africa with the exception of a region around the Democratic Republic of the Congo, Cameroon and part of Nigeria, plus northern Australia.
The only regions where there are significant overlaps between good wind and PV resources are the west coast of Australia and the Horn of Africa.
The costs of electricity from utility-scale solar PV depend on the capacity factor — defined in the same way as for wind— plus the installed cost and the weighted average cost of capital. The latter has been set at 5.5%, based on the Grant Thornton report cited earlier.
Although installed costs are falling rapidly, a range from $700/kW to $1,300/kW is likely to encapsulate the majority of systems currently being installed.
There is no unique relationship between solar insolation and capacity factor; systems with fixed panels deliver lower capacity factors than those whose orientation is varied in accordance with the position of the sun, but these cost more to build.
With this caveat, PV systems in regions with low horizontal irradiance — 175W/m2, say — deliver capacity factors around 10% and costs of energy at $100/MWh; those in areas with irradiance around 200W/m2 deliver capacity factors around 15% and costs of energy around $75/MWh, while those in the sunniest regions (irradiance around 225W/m2) deliver capacity factors of about 18% and costs of energy around $60/MWh.
However, in locations such as southern California, where the average irradiance can exceed 300W/m2, capacity factors for fixed-tilt systems average 25% and 30% for tracking systems.
The overall average cost of energy from utility PV in the US is around $65/MWh.

Major changes
There is a consensus that both wind and solar costs will continue to fall.
The National Renewable Energy Laboratory’s Annual Technology Baseline for 2018 expects the cheapest solar energy cost to fall to $21/MWh by 2020, with the cheapest wind at $31/MWh.
Even the traditionally conservative International Energy Agency concedes that major changes are under way in the energy field.
In the 2018 edition of its World Energy Outlook, published in November, it observes: "The world is gradually building a different kind of energy system, but cracks are visible in the key pillars... The costs of solar PV and wind continue to fall, but oil prices climbed above $80/barrel in 2018 for the first time in four years; and hard-earned reforms to fossil-fuel consumption subsidies are under threat in some countries."

.png)


.png)


