The 2015 edition of the report suggested there would be just over 5,000TWh of annual generation from renewables by 2035. The latest edition — just three years later — suggests that figure will exceed 8,000TWh, an increase of more than 50%.
BP attributes most of this increase to solar energy, but it also includes 1,000TWh of extra wind energy. An increase of this amount corresponds to around 320GW of wind capacity. Projections from three sources are shown in the figure.
The chart below that BP’s projection is slightly higher than the advanced-scenario estimate by the Institute of Energy Economics, Japan (IEEJ) assuming that policies are put in place to encourage low-carbon technologies. The BP/IEEJ projections are almost double those of the US Energy Information Administration’s (EIA), which suggests that the latter takes a fairly cautious view. The EIA’s 2,000TWh for wind by 2030 corresponds to around 650GW, which is about half the "low" estimate from the Global Wind Energy Council. If wind actually achieves double the EIA projection, it will be generating around 4,000TWh by 2030. That corresponds to 11.2% of world electricity generation.

Costs
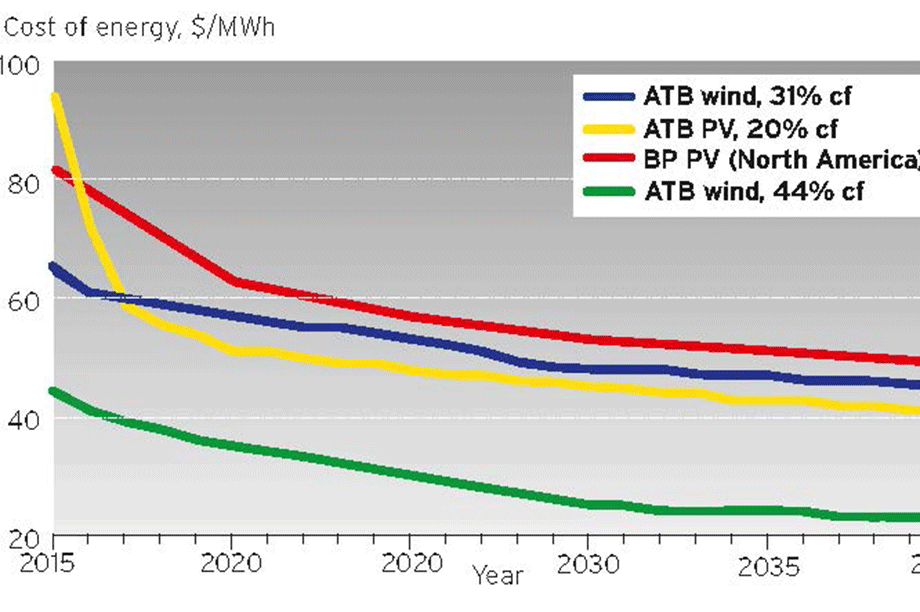
BP also includes projections of future electricity costs from PV in the US. These are compared with data for both PV and wind from the US National Renewable Energy Laboratory’s Annual Technology Baseline (ATB). The ATB includes a wide range of projections for both technologies and the values used here are representative of mid-range installed costs and capacity factors.
The generation costs quoted by the ATB for PV start from a higher level than those quoted by BP, but from 2020 the figures are lower than suggested by BP. This may be due to the use of a different interest rate, or other assumptions. The ATB PV data uses a capacity factor of 20%, which is a mid-range figure.

There is now little difference between wind and PV energy costs. Wind will be generally cheaper in areas with high winds, and PV in areas with high solar insolation. Both the ATB and BP expect the costs of both technologies to continue falling.
Prices lower than the ATB projections for wind have already been realised. Another recent auction result comes from Alberta, in Canada, where four bidders were successful at prices between US$24/MWh and US$34/MWh. The weighted average was $29/MWh. The anticipated cost of one of the projects was $1,242/kW, and the capacity factor 45%. This installed cost was just above the low-end figure in our annual cost review in February and is significantly lower than the average reported for the US for 2016 in Lawrence Berkeley Laboratory’s annual review.
Whereas the decline in costs between 2015 and 2016 was quite modest, this suggests that prices fell significantly during 2017. This is borne out by financial presentations from wind turbine manufacturers Siemens Gamesa and Vestas, both of which reported lower average selling prices for turbines during 2017.
There is growing confidence in the ability of the renewable energy sources to deliver high percentages of electricity to utilities. The California Independent System Operator, for example, expects the state to get more than two thirds of its electricity from non-fossil and non-nuclear resources by 2030.
One factor that is possibly behind this boosted confidence is the fact that "advanced technologies are transforming renewables from a grid integration challenge into a solution", according to Deloitte Centre for Energy Solutions’ 2018 Outlook on Renewable Energy.
At a glance — This month’s report conclusions
BP Energy Outlook 2018 Comprehensive review of all developments in the energy field, showing increased projections for renewables since previous report in 2015
2017 Annual Technology Baseline, NREL, 2017 Cost and performance data (both current and projected) for both renewable and conventional technologies
IEEJ Outlook 2018, The Institute of Energy Economics, Japan, October 2017 Prospects and challenges to 2050
.png)


.png)