Of Germany’s offshore-wind projects that report their electricity generation, the 288MW Dan Tysk project topped the load-factor pecking order in 2017 with an impressive 50.34%. The North Sea project, developed by Vattenfall, was commissioned in 2015. Like a number of other projects looked at here, it is equipped with Siemens Gamesa Renewable Energy (SGRE) SWT-3.6-120 turbines.
Not far behind, despite being located in the Baltic Sea, which is usually considered to have lower wind speeds than the North Sea, came EnBW’s combined Baltic 1 and 2 projects on 48.45%. Baltic 1 (48.3MW), using the older SGRE SWT-2.3-93 turbine model, was commissioned in 2011. The 288MW Baltic 2, equipped with the 3.6MW SGRE turbine, followed in 2015.
Sandbank, Amrumbank West and Borkum Riffgrund 1 — all located in the North Sea — also achieved more than 40%. Gode Wind 1 and 2 were only operating for roughly ten months in 2017, and hence produced lower load factors of under 38%. Bard Offshore 1 reported generation only from April to the end of 2017, resulting in a load factor of 26.26%.

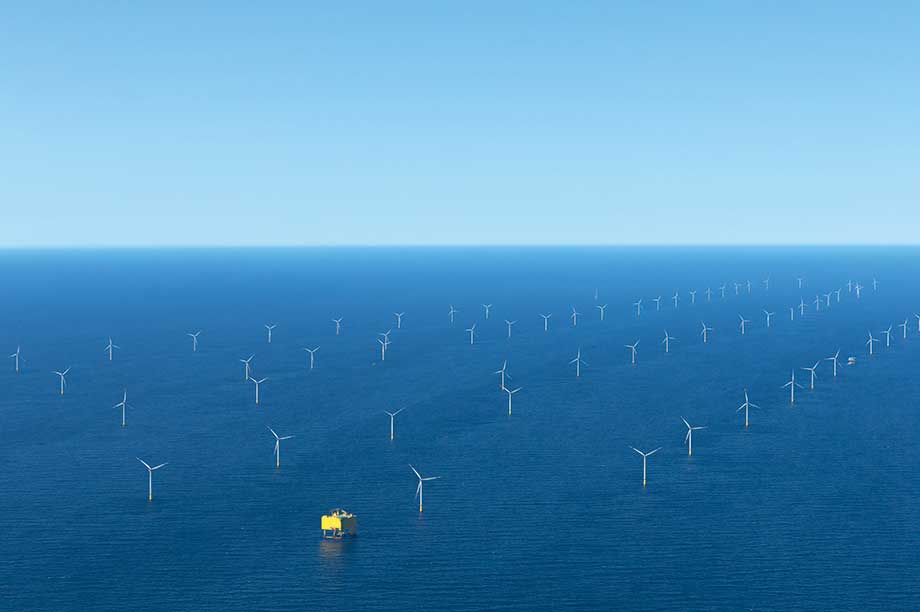
Sandbank in the German North Sea, using the SWT-4.0-130, recorded a load factor of 44% (pic: Ulrich Wirrwa/Vattenfall)
Nordsee Ost (295MW) managed only 37%. In February 2017, the operator complained about the failure of rotor blades on its 6.15MW Senvion turbines. The 322MW Nordsee One project only began full commercial operation in December 2017, and is therefore not considered here.
Five German offshore projects are currently not reporting electricity generation data: Butendiek, Global Tech 1, Meerwind Süd/Ost, Trianel Borkum 1, plus Veja Mate, which started full operation in May 2017. The 350MW Adwen AD 5-135-equipped Wikinger project, which was brought into operation in spring 2018, has now begun reporting data, according to data from the Fraunhofer IEE institute.
The 288MW Butendiek project, comprising 80 SGRE SWT-3.6-120 turbines, is located 32km west of the island of Sylt. In 2016, the first full year of operation, electricity feed-in was prevented for several days in August due to a failure at the SylWin Alpha converter platform, serving the transmission link to the onshore network. Butendiek generated 1,140GWh in 2016, a little lower than the anticipated 1,280GWh, indicating 3,958 full load hours or a load factor of 45%.
The similarly sized and equipped Meerwind Süd/Ost project, 23km north of Helgoland, was fully commissioned in June 2015. In 2016 it generated 1,134GWh, slightly below the hoped-for 1,360GWh, which majority stakeholder Three Gorges Offshore Germany attributed to lower than normal wind speeds over the year. At end of October 2017, it expected output to fall short of the forecast 1,330GWh, but to be significantly higher than its 2016 performance. Assuming 1,250GWh — midway between the two numbers — it achieved around 4,340 full load hours or a load factor of 49.5% in 2017.
Trianel Borkum 1 comprises 40 Adwen 5MW AD 5-116 turbines (formerly Areva) and lies 45km north of the island of Borkum. Commissioning began in February 2015 and was fully completed by December that year. In early 2016, one of the turbines suffered a main bearing failure. It was dismantled in August 2016 with the aim of replacing it last spring. Another turbine suffered transformer damage in March 2016, which was repaired a couple of months later. But other improvements were still being carried out last year, indicating a probably less than optimal load factor over 2017.
The 400MW Global Tech 1 project, 180km north-west of Bremerhaven, also uses the Adwen 5MW turbine. The operator did not report electricity generation for 2016, and noted that a campaign for service and replacement of large components could not be completed in 2016 and had to be extended into 2017, signalling a probably less than satisfactory performance last year.
The 402MW Veja Mate project, 95km north-west of the island of Borkum, is equipped with 67 SGRE SWT-6.0-154 turbines. It is one of the first to deploy SGRE’s new generation of turbine technology. It was completed in mid-2017, but is so far not reporting generation data.
Output in UK waters
The standout performer in UK waters over 2017 was Ørsted’s (formerly Dong Energy) 183.6MW Walney 2 project in the Irish Sea. This generated 780GWh last year for a load factor of 48.58%, according to figures from the UK’s Office of Gas and Electricity Markets (Ofgem). Its output is worth comparing to its close neighbour, the identically sized Walney 1 project, which generated 657GWh for an average load factor of 41.09%. The only real difference between the two developments is that Walney 1 uses the SGRE 3.6MW turbine with a rotor diameter of 107 metres and hub heights of 83.5 metres against the 120-metre rotors and 90.15-metre hub height of the turbines at Walney 2.
Ørsted’s 210MW Westermost Rough project in the North Sea, the first large-scale UK development to deploy SGRE’s SWT-6.0-154 turbine, generated 864GWh in 2017 for a load factor of 47.08%. Output exceeded 50GWh for 11 of the 12 months, touching 100GWh in October and December. The low point was March, when wind speeds were well down on the average (see below) and only 24GWh was generated.

Westermost Rough was the first UK project to deploy SGRE’s SWT-6.0-154 turbine and achieved a load factor of 47% last year (pic:SGRE)
E.on’s 219MW Humber Gateway, commissioned in April 2015 and equipped with MHI Vestas V112-3MW hardware, generated 806GWh for a load factor of 46.08% last year. No output was recorded for March by Ofgem.
West of Duddon Sands — developed by Ørsted and ScottishPower and commissioned in 2014 — is another Irish Sea project that performed well last year. The 389MW development, running the ubiquitous SGRE SWT-3.6-120 turbine, generated 1,504GWH of electricity for an average load factor of 44.37%. Output ranged from 79GWh in March to 182GWh in October. The December figure of 82GWh was well down on comparable sites, possibly indicating the effect of maintenance work addressing leading-edge erosion issues on the turbine blades, likely to affect other SGRE 3.6MW-equipped projects through 2018.
Still the world’s largest operating offshore wind project, the 630MW London Array generated 2,061GWh in 2017 for a load factor of 37.45%, slightly up on the previous year’s output (1,851GWh), despite concerns over the blades’ resilience.
The first project to use the MHI Vestas V164-8.0MW turbine — the 254MW Burbo Bank Extension in the Irish Sea — made a promising start to its operational life, generating output from April 2017. The load factor for the last nine months of the year was 38.36%, but rose to 53.86% in the last quarter of 2017, when all the turbines were up and running and wind speeds were high.
Data comparisons
Full load hours (or load factors) achieved by offshore wind projects are helpful as a comparison of performance from one year to another, and against other offshore developments. Higher load factors indicate more continuous generation, which enables the electricity to be better integrated into the electricity system, notes Sebastian Pfaffel, offshore wind expert at the Fraunhofer IEE institute.
"It must be considered, though, that full load hours depend heavily on site-specific wind conditions and the installed turbine type," he says.
Lower than expected load factors can result from matters the project operator can influence, such as technical problems, maintenance outages or inter-array cabling problems. Maintenance and logistic strategies leading to shorter reaction times can make a positive difference. Wind projects sited adjacent to each other, or that are equipped with a technician’s "floatel" at sea could, for example, reduce the length of waiting time to maintenance, and thus allow higher output.
External factors beyond the operator’s control — such as faults or maintenance outages of the export cable system to the onshore electricity transmission network — can also play a role. Generation is also affected if the transmission system operator curtails the output due to transmission bottlenecks in the onshore network, points out Pfaffel.
Below average wind speeds in European waters during 2017
AWS Truepower’s Wind Trends Bulletin for 2017 revealed marginally lower than average wind speeds across the year for most German and UK offshore developments, although this was more pronounced in the North Sea than the Baltic and Irish seas.
There was, however, an extremely wide range of variation from the norm. January 2017, for example, saw wind speeds that were 21% down on the monthly average in Germany, and 17.3% down in the UK. By contrast, wind speeds in June were 7.6% higher than the average in Germany and 17.3% up in the UK.
Monthly output from the 630MW London Array project in the Thames Estuary illustrates the extent of the effect on electricity generation. In June 2016 it produced 113GWh for a load factor of just over 25%. In the same month last year, it generated 158GWh, a load factor of more than 34%.
December was the best month for London Array last year, with 270GWh generated, translating to a load factor of 57.6%. That still left it a long way short of the output generated in December 2015, when wind speeds were particularly high. Output then was 365GWh, providing a load factor of 77.8%. The 70% mark has only been exceeded one other time in London Array’s operating history — in February 2014, when it generated 306GWh (72.2%).
March was easily the worst month for wind speeds in Europe last year. London Array’s output reached only 77GWh for a load factor of 16.4%.
Shaun Campbell
.png)


.png)


