In order to prepare for these faults, it is essential to understand, which parts are likely to prove the greatest liability, so we thought it would be useful to look at some of the research into component failure rates. Fault data from many projects is unfortunately a closely guarded secret, but there is some information out there that can shed a light on just what goes wrong with turbines.
The EU's Reliawind project studied more than 4,000 onshore turbines and revealed the percentage contribution of each component towards total turbine failures. Data from this project (shown in the pie chart above) finds that the pitch system was the worst culprit, being responsible for 16% of all failures. The yaw system was close behind, accounting for 12% of faults.
At the other end of the scale were gearboxes, which only caused 5% of turbine breakages. Similarly, generators proved reliable, making up only 6% of failures.
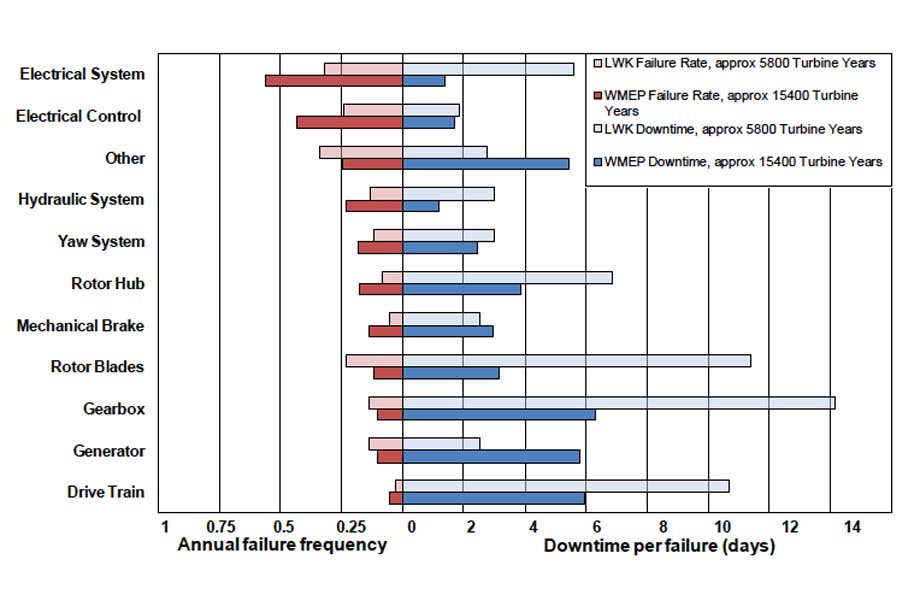
However, for some elements that break less frequently, the time that turbines are down as a result can be much greater. Indeed, the statistics from Landwirtschaftskammer Schleswig-Holstein (LWK) (shown in the bar graph above) show that gearbox failures result in average downtime in excess of 14 days. This compares wirh less than two days for the electrical control system. So while they may fail less frequently, gearboxes and drivetrain problems can result in greater downtime overall.
Studies of offshore failure rates are less comprehensive. One study however, presents the annual operations reports from Egmond aan Zee wind farm in the Netherlands, including a breakdown of stops for the year. This project is not particularly representative, however, as it is made up of 36 Vestas V90-3MW turbines.

The issues with the these turbines' gearboxes has been well documented and the machines on this project were subject to a planned gearbox upgrade during the second year of operation, which will have skewed the average downtime presented in the graph here.
Direct comparison between the onshore and offshore data is not possible as the offshore figures are for stoppages rather than failures. However, it is clear that the distribution of fault rates is broadly similar to the onshore data. High-failure-rate components also do not account for the greatest amount of downtime. Control system failures are most common, making up 36% of stoppages, but causing only 9.5% of the total downtime. In comparison, gearboxes caused only 6.7% of total stops but 55% of the downtime.
What will happen to these downtimes as wind farms move further from shore remains to be seen, but it is likely that all components will see an increase and that there will be a less extreme range in downtimes, with access problems to the projects accounting for the majority of the time.
The scientific measurement and evaluation programme (Wissenschaftliches Mess-und Evaluierungsprogramm – WMEP) database was compiled from 1989 to 2006 and contains failure statistics from 1,500 wind turbines. Failure statistics published by the agricultural chamber of the German federal state of Schleswig-Holstein (LWK) cover 1993 to 2006 and contain data from more than 650 wind turbines.
.png)


.png)