Ultimately it is about developing our understanding of what is happening with wind-flow conditions across the site as well as the long-term climatology. This information can then guide decisions throughout all stages of a project's lifecycle - development, construction and operation.
Many people see the development stage as the only place where measuring wind is important, but really it is just the first stage of the measurement campaign.
The basic wind resource components we are trying to understand during this stage are: orientation, wind speed, shear and turbulence. Much like the planning process, the measurement campaign design should respect project cash flow, applying appropriate tools at the right time to reduce uncertainty in the intended upcoming energy assessment.
Desktop studies
In the early stages of a project, with no nearby physical measurement assets available, the first step in designing a wind resource campaign is to conduct a desktop study estimating the resource. This kind of assessment usually considers the predominant wind direction and mean annual wind speed across the project area. Whether they use publicly available resources, such as the UK's free wind-speed database, or newer commercial products, these products and services should only be used as guides for deciding whether the project is worth pursuing by passing the basic financial and project risk tests with substantial margin.
The next step is to understand what the initial layout looks like. Some basic geographic information system (GIS) mapping with the identified land, appropriate constraints - such as houses, forests, water courses and roads - and relevant buffers will leave the 'available land' area. This can sometimes show that the project is smaller than expected, so when done well this mapping can guide land acquisition and help correctly size the project early on.
Next, a site visit is advisable to confirm the mapping matches what is on the ground. Visiting is important because it will help give a feel for the extent and characteristics of any forests and forestry activities, ensure that the building and water course mapping is reasonably correct and that the terrain mapping is in line with expectations.
The initial site visit is also useful for deciding how physical meteorological assets can be installed and potentially help refine the initial layout.
Once a good initial layout has been developed, the campaign is designed and the main aim is for representativeness. This is key because, as good as wind-energy modelling programmes are, the measurement campaign can dramatically influence any assessment. If the meteorological (met) tower is located in a valley downwind in the prevailing direction from a hill or forest, it is unlikely to be representative of a project based on the hill top five kilometres (km) away. The measurements would very likely be low-biasing the wind speed data, which cannot be modelled out easily. Having a poorly placed met tower can have a negative effect on a project's financial and technical discussions. Likewise, measuring wind at the top of the hill if the majority of the project is down the hill can lead to unmet expectations once operational.
Basic rules for representativeness:
Spatial For a site of medium complexity, is the met location within 2km of all turbines? If not consider using a staged approach. If the site has significant complexity, such as a ridgeline, 1km distance is suggested.
Elevation For a site with rolling hills but not more than 15 turbines, is the location near the project's weighted mean elevation? This is crucial for achieving good energy modelling of complex sites. If the elevation spread is more than 20 or 30 metres between the met mast and a number of the turbines, I would recommend a multiple met asset strategy, potentially using remote sensing.
Exposure Is the met tower "seeing" what the turbines are going to be exposed to? If the project is in a forest and the met asset is in an open field or beside a barn, the data likewise will be incorrectly influenced to the detriment of the project expectations.
Getting the details right
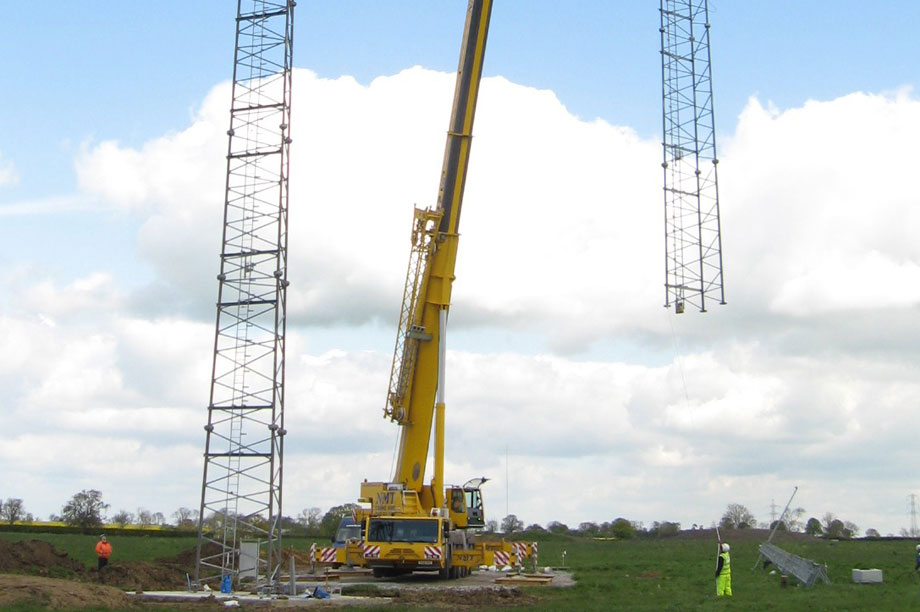
With a met location sorted out on the desktop, another site visit is necessary to make sure the location is actually buildable. Some jurisdictions are less concerned with the discrete coordinates of the installed met tower but others are adamant on location, tower structure and sensor elevations, so it is best to measure twice and cost effectively install once - it will save time, money and potentially political capital if the permitted site is found impossible or prohibitively expensive to build on.
But why a met tower, why not remote-sensing technologies such as Sodar (sonic detection and ranging) or Lidar (light detection and ranging)? Current best practice would have these technologies supporting a met tower rather than replacing it. Each technology has distinct advantages and disadvantages and as such should be considered a supplement to the met tower and be implemented with the advice of experts.
When it comes to instruments on a met tower there are a few different strategies. The base tower configuration I prefer is to have three levels of anemometer pairs, a maximum of 25 metres apart, with a wind vane located two metres below both the top and bottom anemometers. Even when following International Electrotechnical Commission (IEC) recommendations on keeping instruments certain distances from the tower to reduce tower influence are followed, the tower shadow is still evident, ultimately lowering the mean wind speed. With sensor pairs, this influence can be virtually eliminated, allowing for a more correct wind speed at all heights, giving a better wind shear estimate and a more accurate resource assessment. Having two sensors is also more cost-effective as it means one is still available if the other stops working, making physical site works not immediately necessary.
So when does all this data become useable, actually breaking or proving early stage assumptions? In my experience, at least six months of very good correlation to a longer-term, well-maintained and known data set is needed. This is really important, particularly if early-stage data is dramatically changing the project orientation or wind-speed assumptions and therefore potential turbine types and project capacity. If the measurement campaign shows dramatic climate swings, patience is required and careful analysis of how this information affects the layout and continuing campaign. As the data set matures with well over 12 months of good results, the project naturally firms up, building confidence in the data set and increasing financeability.
Valued paper trail
The real lynch pin in the campaign design process, particularly during the development phase, is documentation. When going to financing, a transparent and trackable paper trail is required that includes:
- Where the met tower was
- When it was commissioned
- What instruments were on it and where
- Whether it was maintained regularly and properly
- What state it was in when it was decommissioned
It will be too late to document these aspects after the fact, so I highly recommend working with good contractors and partners who appreciate the long-term requirements to excel during the financing phase.
Construction and operational stages
The construction stage of a measurement campaign is mainly about good project management and rigour to standards. This phase normally happens in the short period between the project receiving a permit and the foundations being constructed. The crucial aspect to remember is that the power-curve measurement strategy is used to prove that the project's turbines are meeting the manufacturers warranted power curves.
The IEC has a power-curve testing procedure and recommended equipment checklist that can be used to test the ambient condition before the turbines are installed. This process is a once-in-a-project opportunity to understand the initial meteorological conditions happening at a test turbine and fits in a small window of time. Doing this potentially saves substantial ambiguity and lengthy litigation.
The operational phase is where all the effort pays off, where production and project performance is constantly audited against its expected values, including mean annual production, known as P50, and that turbines are performing against warranted levels. Recently there has been a lot of effort to understand why many projects are not achieving their P50 energy, and although the lack of a good measurement campaign is not solely to blame, a more robust strategy during the development and construction stages of the measurement campaigns could have helped prevent disappointing results.
Stephen Tordoff is wind resources manager at Falck Renewables Wind
.png)


.png)