More capacity has been added so far this year in the US (8.6GW, compared with 3.5GW); Europe (8.2GW, compared with 5.7GW last year); and Latin America (1.3GW, compared with 224MW). Small increases have been observed in the Middle East, but the Asia-Pacific region increment is smaller - 12.6GW, compared with 14.8GW last year. It should be noted that some authorities are reporting significantly higher installed capacity for China, which is probably explained by completed machines awaiting grid connection that are included in other sources' figures but excluded from ours.
The star performers so far this year include the UK, where 2.1MW has been added - 35% growth; and Poland with 573MW (also 35%). Sweden has been a strong performer too, with 557MW added, or 19% growth.
At the top of the league, however, are China and the US, with 10.2GW and 8.6GW added, respectively. There are signs that the long-awaited surge in Latin American wind is coming to fruition, with 1.3GW added this year, or 51%. All these countries have beaten the overall world increase of 14%.
Although quarterly additions are not a particularly reliable indicator because the reporting periods are not all the same, they have ranged, globally, between 9-12GW so far this year, which suggests that the capacity at the end of the year is likely to be at least 260GW and possibly more.
Click here for installed capacity data
Future prospects
The outlook for the future is, however, more difficult to predict, as there are uncertainties in at least three major markets: the US, the UK and China.
The re-election of US President Barack Obama improved prospects for continuation of the US federal production tax credit but did not guarantee it. If an extension is not agreed, expiry takes effect on 31 December 2012, and the American Wind Energy Association has predicted that there will be substantial job losses. There is already a slowdown in activities related to new developments.
In the UK, the uncertainties centre around the electricity market reform package being put together by the government. This envisages contracts for difference for non-carbon electricity generation sources, including nuclear. However, the exact form that these contracts will take and how prices will be set is still unclear - and the wind industry is waiting for other details too.
The prospects for onshore wind in the UK are also uncertain, after ambiguous remarks by one of the energy ministers, who suggested no more installations were needed, although a more senior minister later denied that there was any change in policy.
In China, problems are partly to do with much-needed transmission links to deliver wind power from wind-rich regions to population centres, and partly with overcapacity in the wind turbine market. Although this is leading to lower unit prices in the short-term, it could be counter-productive in the longer term - especially if the market overreacts, leading to supply shortages.
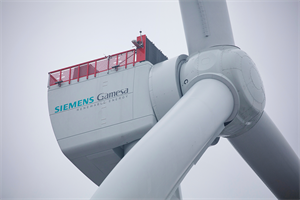
News from manufacturers is mixed. Vestas is seeking to sell a stake of up to 20% and will reduce staff levels by 3,000, on top of reductions previously announced. Gamesa has announced a 17% fall in turbine sales for the first three quarters of the year compared with the previous year. The Spanish turbine manufacturer also plans to cut its workforce by 20% in the period 2013-15.
Competition
European wind turbine manufacturers are facing strong competition from the Chinese market, and so prices appear to be easing slightly. Wind now faces formidable competition from gas in the US, although gas prices have firmed up a bit since the summer. The low prices in the US are largely due to continuing exploitation of shale gas, but it still seems unlikely that there will be many significant developments in Europe. European gas prices are now roughly three times those in America, meaning the competitive position of wind is stronger in Europe.
Wind now seems unlikely to face competition from gas-fired generation fitted with carbon capture and storage (CSS), with respected utilities analyst Peter Atherton writing in the UK's Daily Telegraph newspaper: "Few people now believe that CCS will become available at an affordable cost in the required timescale" - that is, the early 2020s. Meanwhile, there is still no clarity from the UK market over the price of nuclear electricity, mainly due to the complexities of the electricity market reform programme. As ďuŚXėšä ė∑≥« goes to press, it seems unlikely that prices for nuclear or renewable electricity will be established before the New Year, so the wind sector enters 2013 with a complex playing field ahead.
The quarterly Windicator is an indicator of the state of play. Changes in the table can be corrections received rather than additions or subtractions. We welcome corrections.
| EUROPE | Start 2012 | Oct 2012 | Extra MW | Change % |
|---|---|---|---|---|
| Germany | 29,075 | 30,500 | 1,425 | 5 |
| Spain | 21,674 | 22,273 | 599 | 3 |
| UK | 5,953 | 8,039 | 2,086 | 35 |
| Italy | 6,747 | 7,470 | 723 | 11 |
| France | 6,640 | 6,951 | 311 | 5 |
| Portugal | 4,291 | 4,291 | 0 | 0 |
| Denmark | 3,871 | 4,038 | 167 | 4 |
| Sweden | 2,907 | 3,464 | 557 | 19 |
| Netherlands | 2,328 | 2,478 | 150 | 6 |
| Poland | 1,616 | 2,189 | 573 | 35 |
| Turkey | 1,799 | 1,906 | 107 | 6 |
| Romania | 982 | 1,750 | 768 | 78 |
| Greece | 1,629 | 1,723 | 94 | 6 |
| Ireland | 1,631 | 1,673 | 42 | 3 |
| Austria | 1,084 | 1,153 | 69 | 6 |
| Belgium | 1,078 | 1,078 | 0 | 0 |
| Norway | 491 | 625 | 134 | 27 |
| Bulgaria | 504 | 593 | 89 | 18 |
| Hungary | 329 | 329 | 0 | 0 |
| Estonia | 184 | 277 | 93 | 50 |
| Finland | 197 | 250 | 53 | 27 |
| Czech Republic | 217 | 223 | 6 | 3 |
| Lithuania | 179 | 205 | 26 | 14 |
| Cyprus | 134 | 164 | 30 | 22 |
| Ukraine | 112 | 145 | 33 | 29 |
| Croatia | 89 | 130 | 41 | 46 |
| Switzerland | 46 | 49 | 3 | 7 |
| Latvia | 30 | 48 | 18 | 60 |
| Luxembourg | 44 | 44 | 0 | 0 |
| Russia | 11 | 11 | 0 | 0 |
| Slovakia | 5 | 5 | 0 | 0 |
| TOTAL | 95,877 | 104,073 | 8,196 | 9 |
| MIDDLE EAST/AFRICA | Start 2012 | Oct 2012 | Extra MW | Change % |
| Egypt | 550 | 550 | 0 | 0 |
| Morocco | 292 | 292 | 0 | 0 |
| Tunisia | 54 | 154 | 100 | 185 |
| Iran | 110 | 110 | 0 | 0 |
| Ethiopia | 30 | 81 | 51 | 170 |
| Cape Verde | 28 | 30 | 2 | 7 |
| Reunion | 15 | 15 | 0 | 0 |
| South Africa | 10 | 10 | 0 | 0 |
| Israel | 6 | 6 | 0 | 0 |
| Kenya | 5 | 5 | 0 | 0 |
| Mauritania | 0 | 4 | 4 | - |
| Jordan | 2 | 2 | 0 | 0 |
| Seychelles | 0 | 0 | 0 | 0 |
| TOTAL | 1,102 | 1,259 | 157 | 14 |
| ASIA PACITIC | Start 2012 | Oct 2012 | Extra MW | Change % |
| China | 45,050 | 55,210 | 10,160 | 23 |
| India | 16,084 | 18,192 | 2,108 | 13 |
| Japan | 2,501 | 2,557 | 56 | 2 |
| Australia | 2,224 | 2,480 | 256 | 12 |
| New Zealand | 622 | 623 | 1 | 0 |
| Taiwan | 564 | 564 | 0 | 0 |
| South Korea | 407 | 407 | 0 | 0 |
| Pacific Islands | 38 | 38 | 0 | 0 |
| New Caledonia | 38 | 38 | 0 | 0 |
| Philippines | 33 | 33 | 0 | 0 |
| Vietnam | 30 | 30 | 0 | 0 |
| Sri Lanka | 30 | 30 | 0 | 0 |
| Pakistan | 6 | 6 | 0 | 0 |
| Thailand | 5 | 5 | 0 | 0 |
| Bangladesh | 1 | 1 | 0 | 0 |
| TOTAL | 67,633 | 80,214 | 12,581 | 19 |
| LATIN AMERICA | Start 2012 | Oct 2012 | Extra MW | Change % |
|---|---|---|---|---|
| Brazil | 1,377 | 1,814 | 437 | 32 |
| Mexico | 519 | 1,260 | 741 | 143 |
| Chile | 188 | 205 | 17 | 9 |
| Costa Rica | 132 | 132 | 0 | 0 |
| Argentina | 108 | 111 | 3 | 3 |
| Honduras | 0 | 102 | 102 | - |
| Caribbean | 91 | 91 | 0 | 0 |
| Nicaragua | 40 | 73 | 33 | 83 |
| Uruguay | 44 | 45 | 1 | 2 |
| Dominican Republic | 33 | 33 | 0 | 0 |
| Guadeloupe | 27 | 27 | 0 | 0 |
| Colombia | 20 | 20 | 0 | 0 |
| Cuba | 12 | 12 | 0 | 0 |
| Ecuador | 2 | 2 | 0 | 0 |
| Falkland Islands | 2 | 2 | 0 | 0 |
| Peru | 1 | 1 | 0 | 0 |
| Martinique | 1 | 1 | 0 | 0 |
| TOTAL | 2,597 | 3,931 | 1,334 | 51 |
| NORTH AMERICA | Start 2012 | Oct 2012 | Extra MW | Change % |
|---|---|---|---|---|
| Texas | 10,377 | 11,272 | 895 | 9 |
| Iowa | 4,322 | 5,252 | 930 | 22 |
| California | 3,927 | 4,601 | 674 | 17 |
| Illinois | 2,743 | 3,563 | 820 | 30 |
| Oregon | 2,513 | 3,265 | 752 | 30 |
| Minnesota | 2,733 | 2,906 | 173 | 6 |
| Washington | 2,573 | 2,756 | 183 | 7 |
| Oklahoma | 2,007 | 2,501 | 494 | 25 |
| Colorado | 1,800 | 2,389 | 589 | 33 |
| Kansas | 1,274 | 1,931 | 657 | 52 |
| Indiana | 1,340 | 1,639 | 299 | 22 |
| New York | 1,403 | 1,526 | 123 | 9 |
| North Dakota | 1,430 | 1,430 | 0 | 0 |
| Wyoming | 1,410 | 1,410 | 0 | 0 |
| Pennsylvania | 789 | 1,028 | 239 | 30 |
| Idaho | 617 | 940 | 323 | 52 |
| New Mexico | 750 | 878 | 128 | 17 |
| South Dakota | 784 | 795 | 11 | 1 |
| West Virginia | 564 | 775 | 211 | 37 |
| Wisconsin | 631 | 636 | 5 | 1 |
| Montana | 386 | 594 | 208 | 54 |
| Michigan | 377 | 495 | 118 | 31 |
| Missouri | 459 | 459 | 0 | 0 |
| Maine | 397 | 430 | 33 | 8 |
| Ohio | 112 | 417 | 305 | 272 |
| Nebraska | 334 | 334 | 0 | 0 |
| Utah | 325 | 325 | 0 | 0 |
| Arizona | 138 | 252 | 114 | 83 |
| Nevada | 0 | 152 | 152 | - |
| Hawaii | 93 | 125 | 32 | 34 |
| New Hampshire | 26 | 124 | 98 | 377 |
| Maryland | 120 | 120 | 0 | 0 |
| Massachusetts | 46 | 59 | 13 | 28 |
| Vermont | 46 | 46 | 0 | 0 |
| Alaska | 10 | 36 | 26 | 260 |
| Tennessee | 29 | 29 | 0 | 0 |
| New Jersey | 8 | 9 | 1 | 13 |
| Delaware | 2 | 2 | 0 | 0 |
| Rhode Island | 1 | 1 | 0 | 0 |
| Arkansas | 0 | 0 | 0 | - |
| United States | 46,917 | 55,502 | 8,606 | 18 |
| Canada | 5,265 | 5,895 | 630 | 12 |
| North America | 52,182 | 61,397 | 9,236 | 18 |
| WORLD | 219,370 | 250,874 | 31,504 | 14 |
.png)


.png)


